Diaper Production Line OEE Bottleneck Guide 2026 | Welldone

Why Your Diaper Line Misses Its Output Target: An OEE Bottleneck Guide
The morning meeting starts with one number: yesterday's packed output missed plan. Production blames downtime, maintenance blames material changes, quality points to rejects, and packing says the discharge never arrived at a stable rhythm. Buying a faster line cannot resolve four different explanations. A loss tree can.
Expanding and Upgrading Baby Diaper Production Capacity · Part 2
Part 1: Calculate the required qualified output and line count.
Part 2 — this article: split the output gap into availability, performance, quality and packing losses.
Next: recover capacity through shift planning and changeover sequencing before specifying hardware.
Part 1: Calculate the required qualified output and line count.
Part 2 — this article: split the output gap into availability, performance, quality and packing losses.
Next: recover capacity through shift planning and changeover sequencing before specifying hardware.
Carry the capacity gap forward, not the machine-speed claim
Part 1 converted monthly sellable demand into a required hourly output. Its illustrative example required 31,731 qualified pieces per hour, while the selected planning record used 24,000 qualified packed pieces per hour. The resulting gap was 7,731 pieces per hour.
Illustrative example only. These figures are not customer data, a Welldone machine specification or a quotation. They are carried forward only to demonstrate the decision chain. Replace them with your own SKU, shift and production records.
A common mistake is to apply a generic OEE percentage to the 24,000 figure again. That would double-count losses because the number already represents qualified packed output. Today’s task is the reverse: open that combined result and identify where the missing output actually went.
Set one measurement boundary before calculating OEE
OEE combines availability, performance and quality, but the calculation is meaningful only when every team uses the same start and end points. Decide whether the counted good unit is accepted at final cutting, after automatic rejection or after packing. Do not mix these boundaries in one report.
Actually, packing should remain a separate constraint when the OEE boundary ends at the main line. Otherwise a slow bagging or stacking process can appear as poor machine performance, while a full downstream buffer can force the line to slow even though the drive system is healthy.
- Freeze one SKU, material set and pack format for each record.
- Define planned production time after approved breaks and planned maintenance.
- Count good units at one named quality gate.
- Record packing release separately if it sits outside that gate.
Availability loss: find where scheduled time disappeared
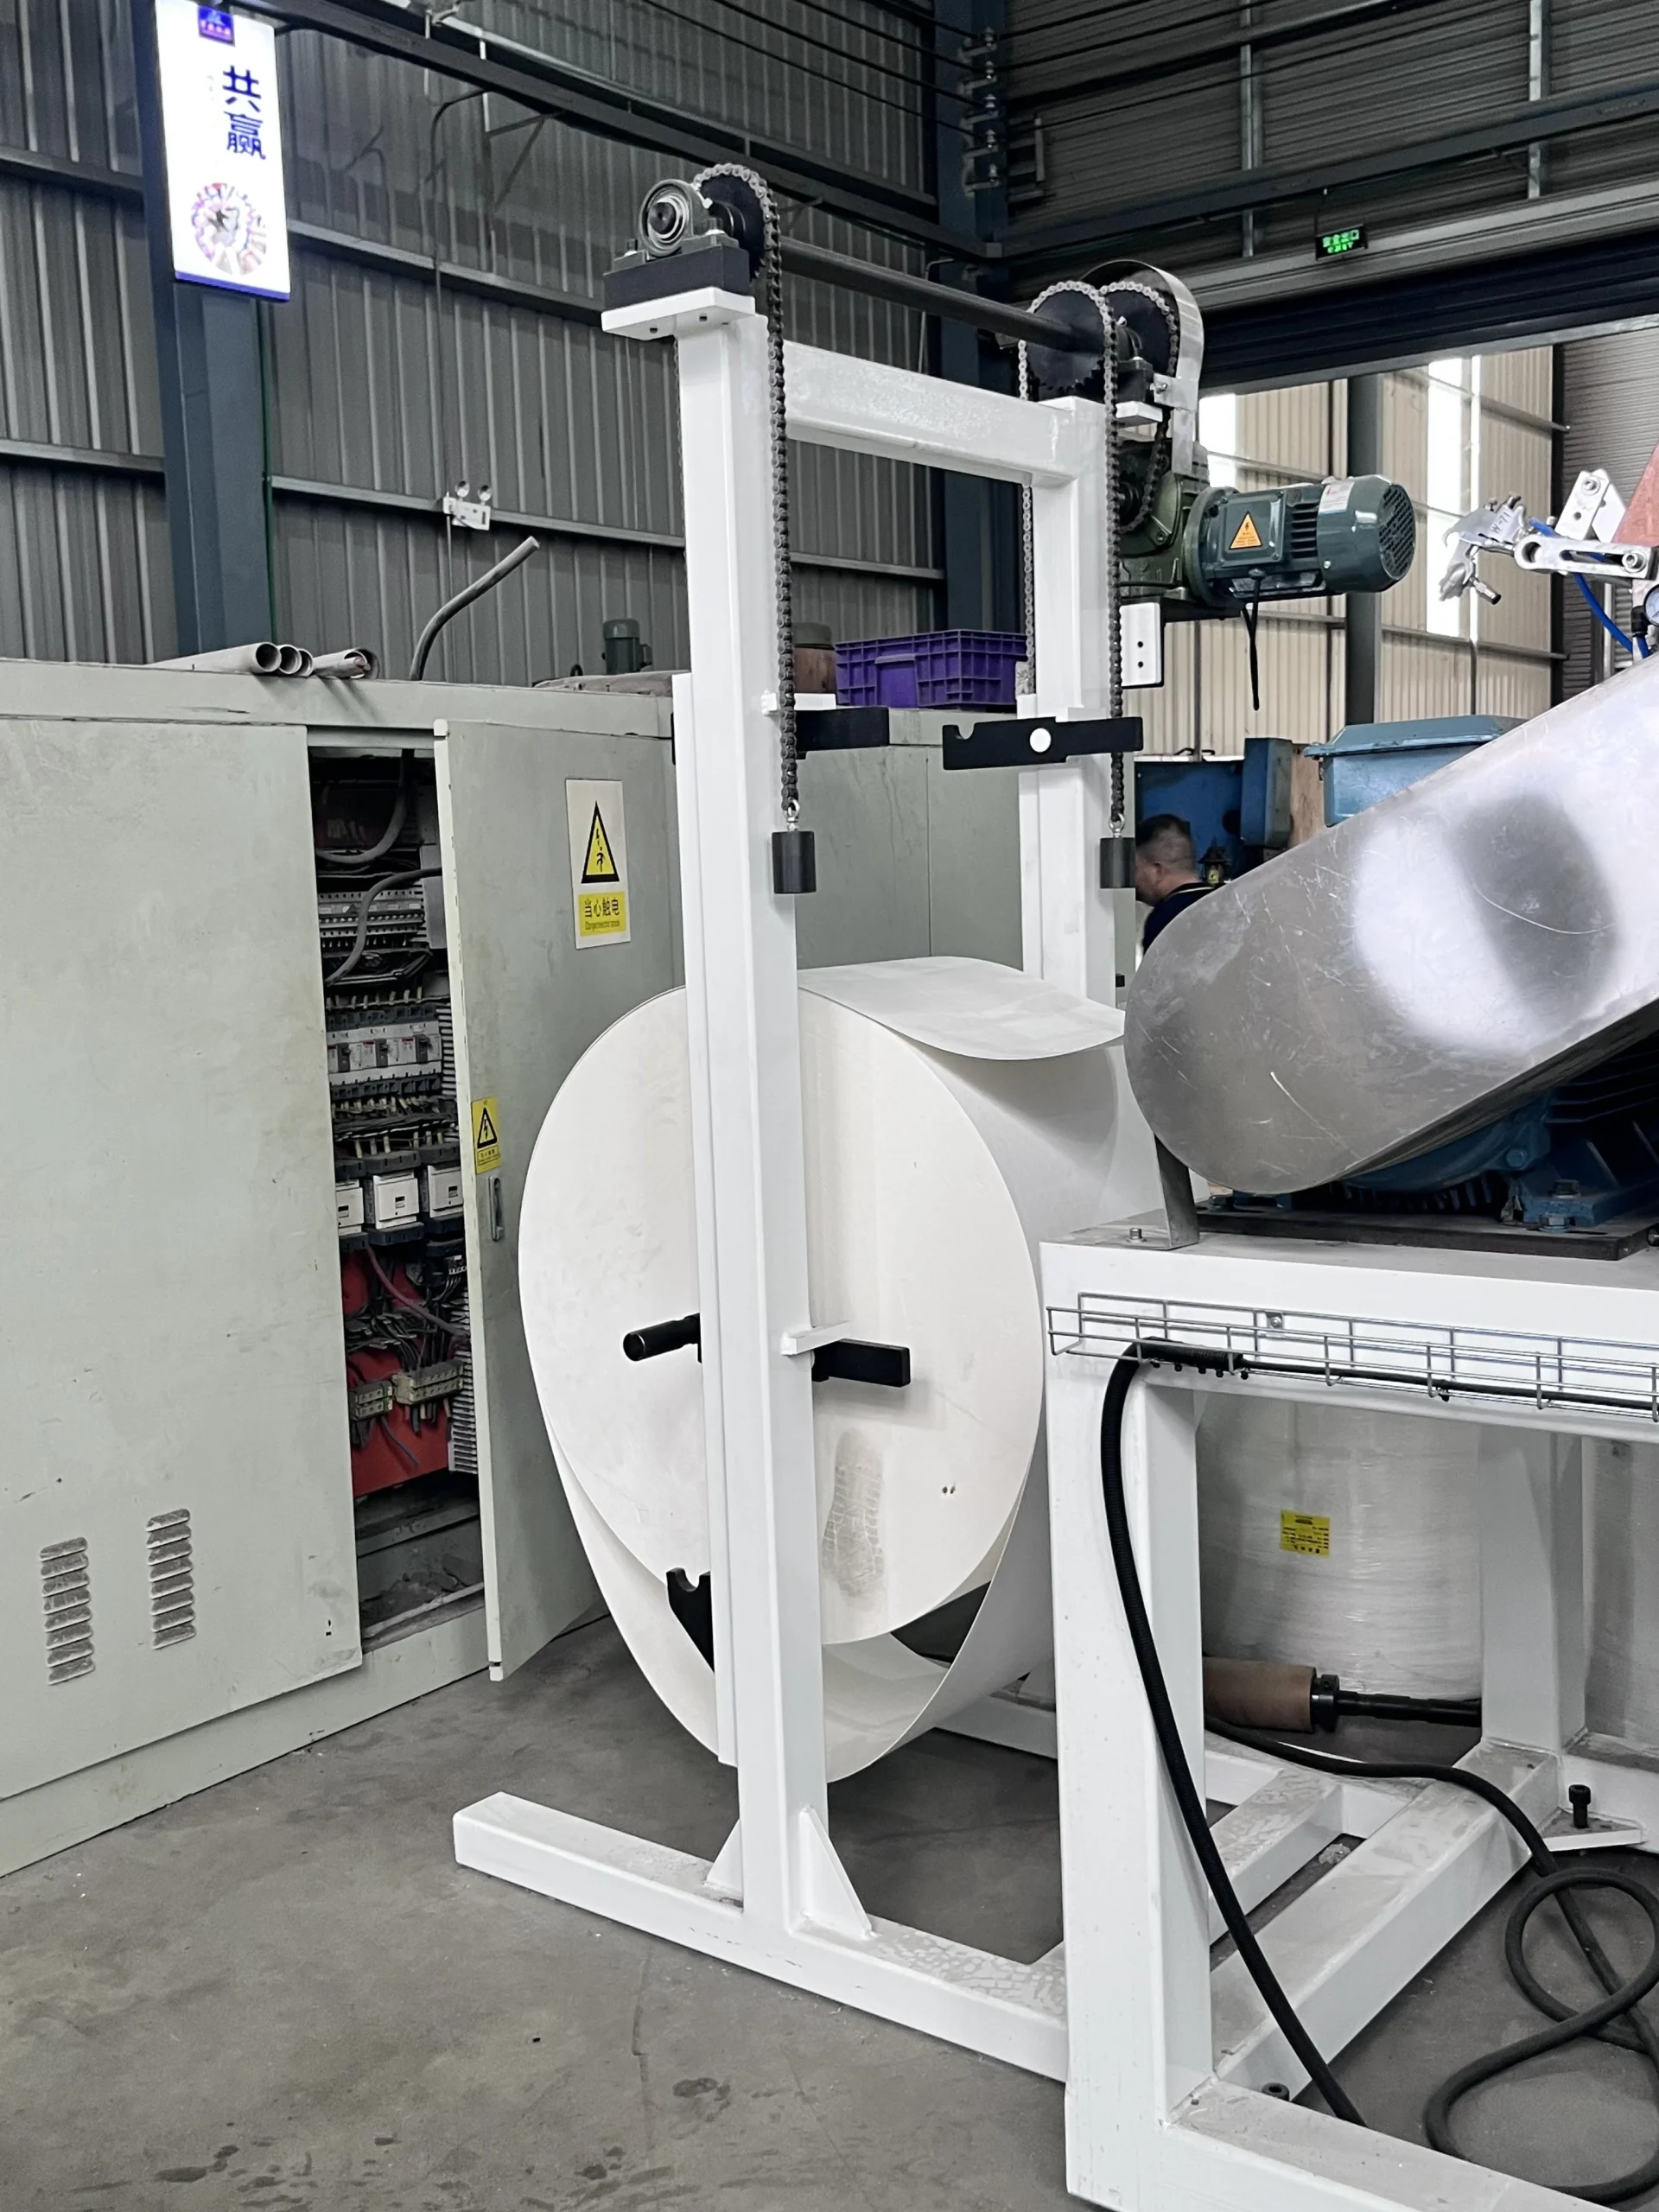
Availability asks how much planned production time became actual runtime. A 40-minute stop caused by a material wait and a 40-minute mechanical repair have the same duration, but they do not have the same countermeasure. The event code matters as much as the clock.
Record the stop start, stop end, station, reason code and recovery action. Planned cleaning, SKU changeover and preventive maintenance should be visible but separated from unplanned breakdowns. If every stop is coded “machine fault,” the loss tree will send investment toward the machine even when materials or scheduling caused the wait.
Performance loss: separate reduced speed from short stops
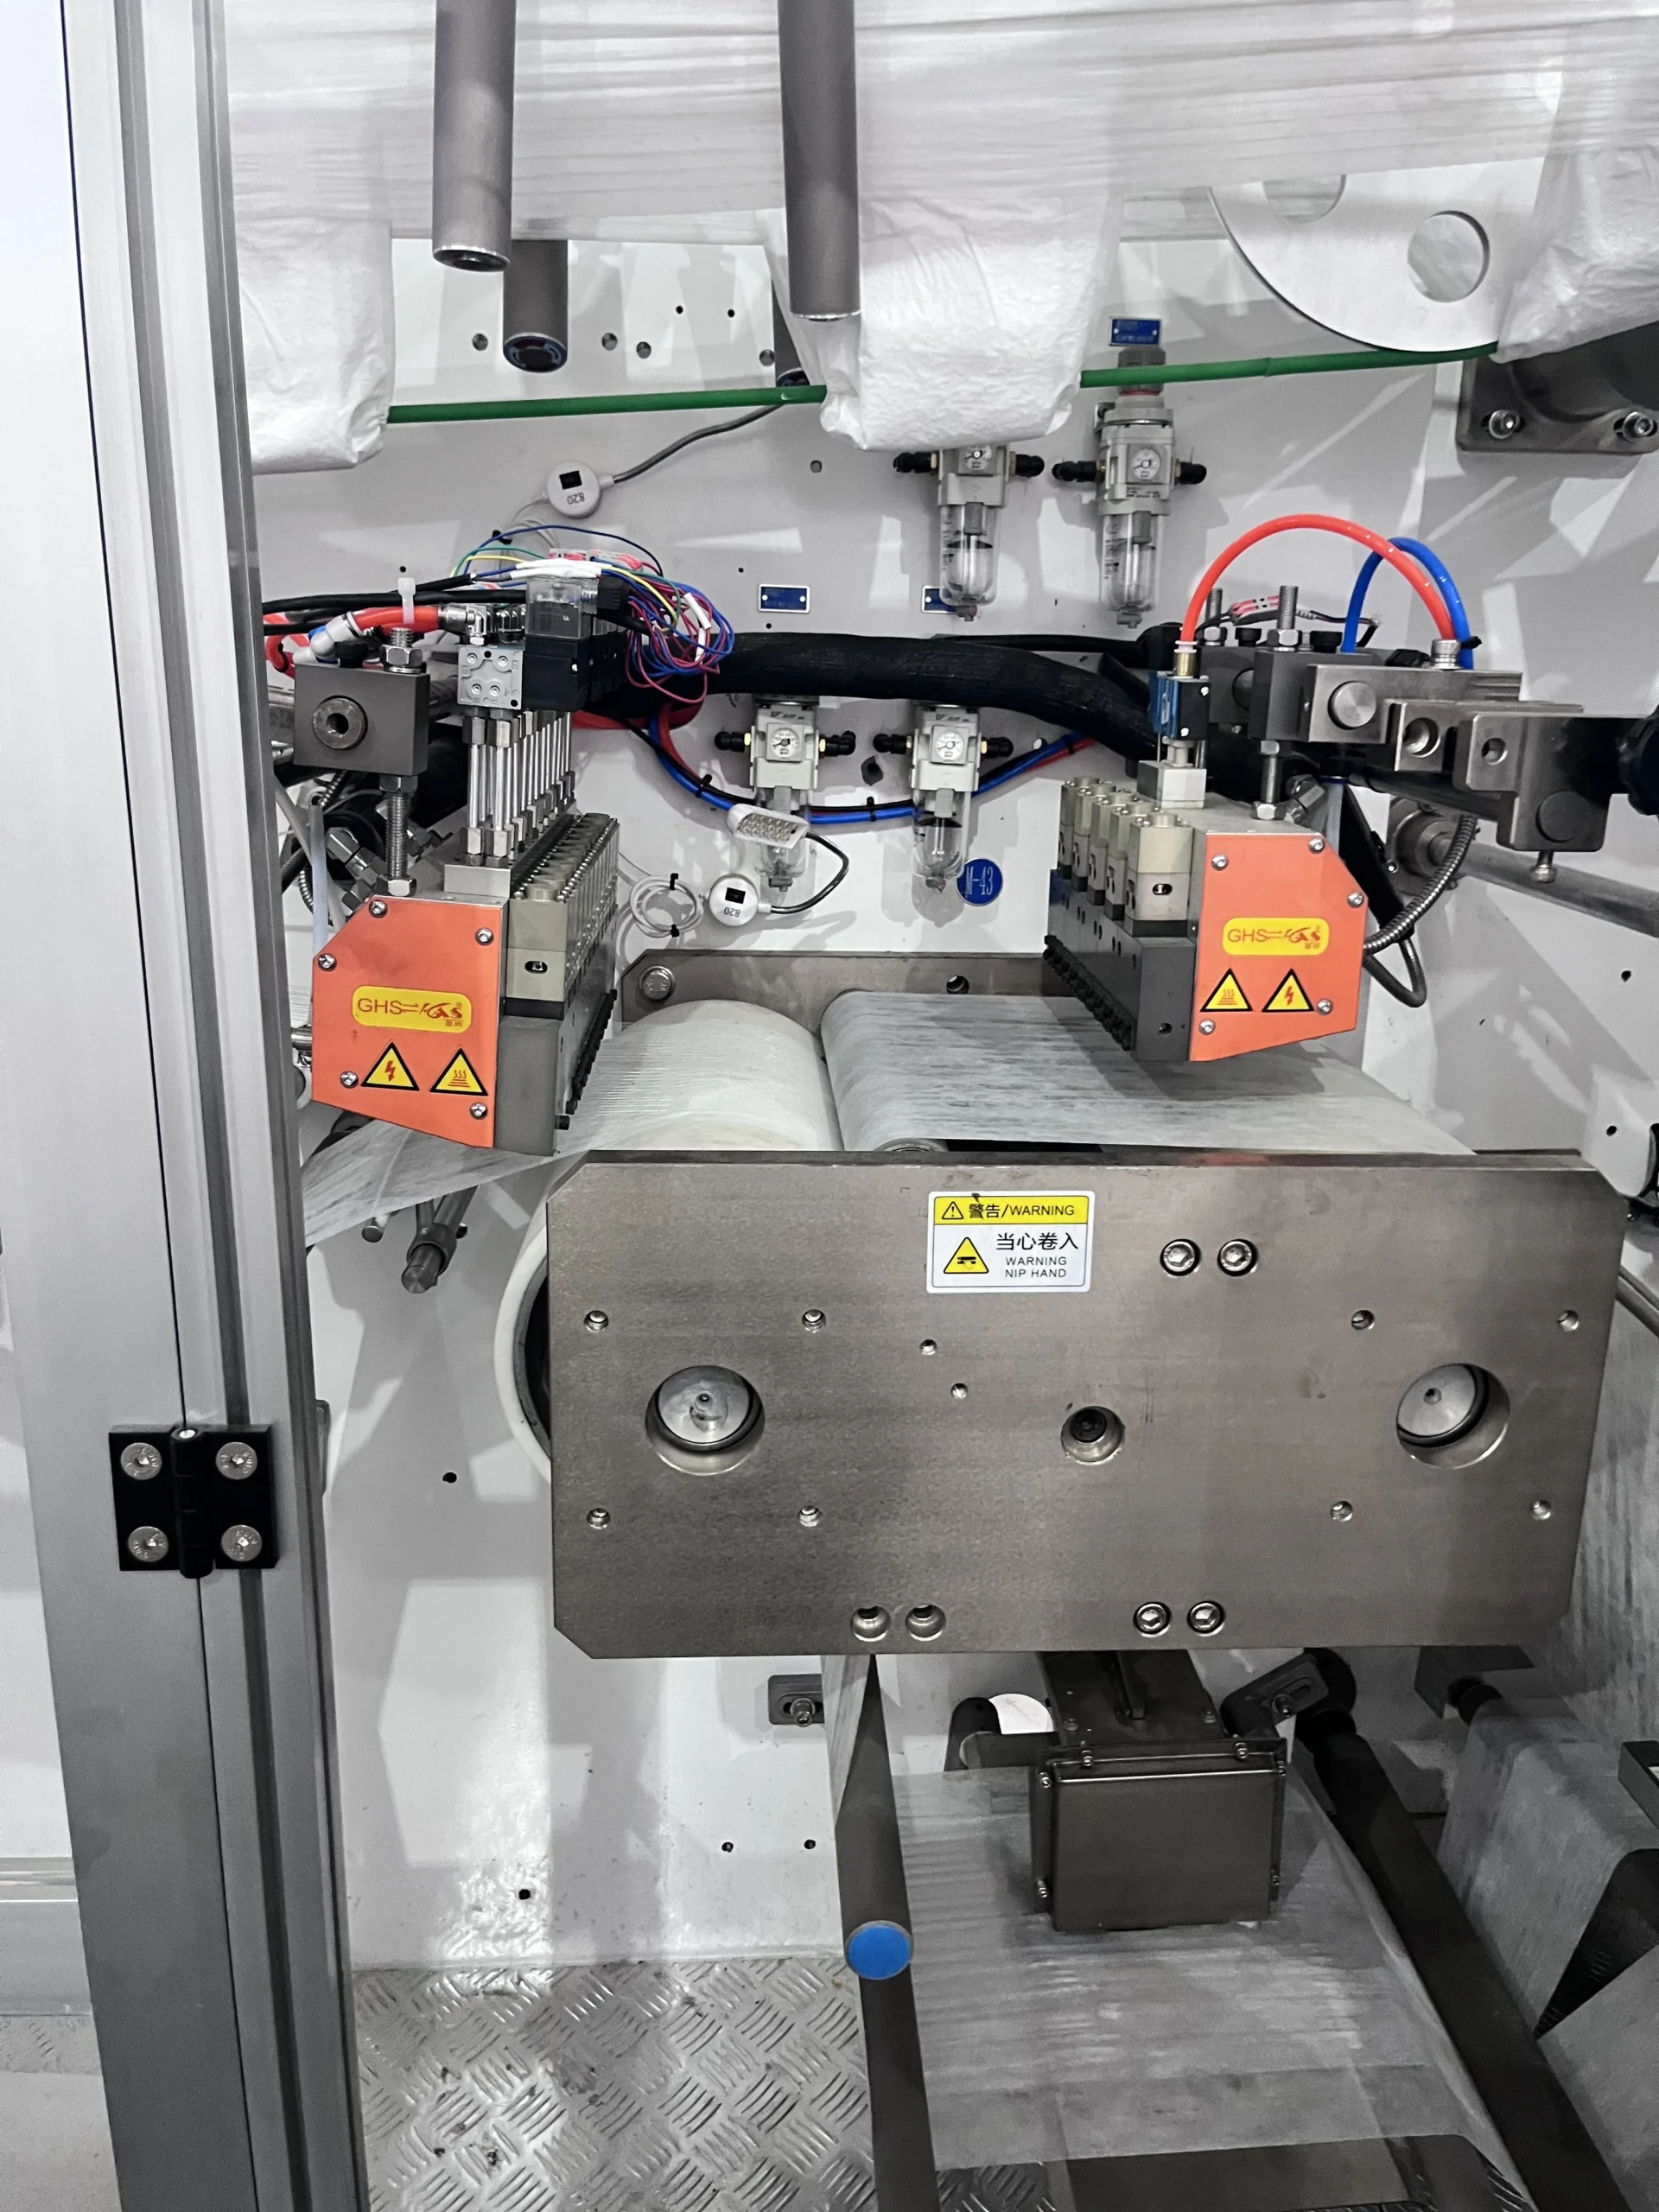
A line may show high runtime and still miss output because it spends the shift below the approved benchmark. Performance loss includes deliberate reduced-speed operation and micro-stops too short to appear in a manual downtime log.
In most cases, the useful benchmark is not catalogue maximum speed. It is the validated rate for the same SKU, BOM, pack format and quality boundary. Compare actual gross count during runtime with that benchmark, then group losses by station and duration. Five seconds repeated hundreds of times deserves more attention than one visible ten-minute stop.
Quality and packing losses: count what the warehouse can release
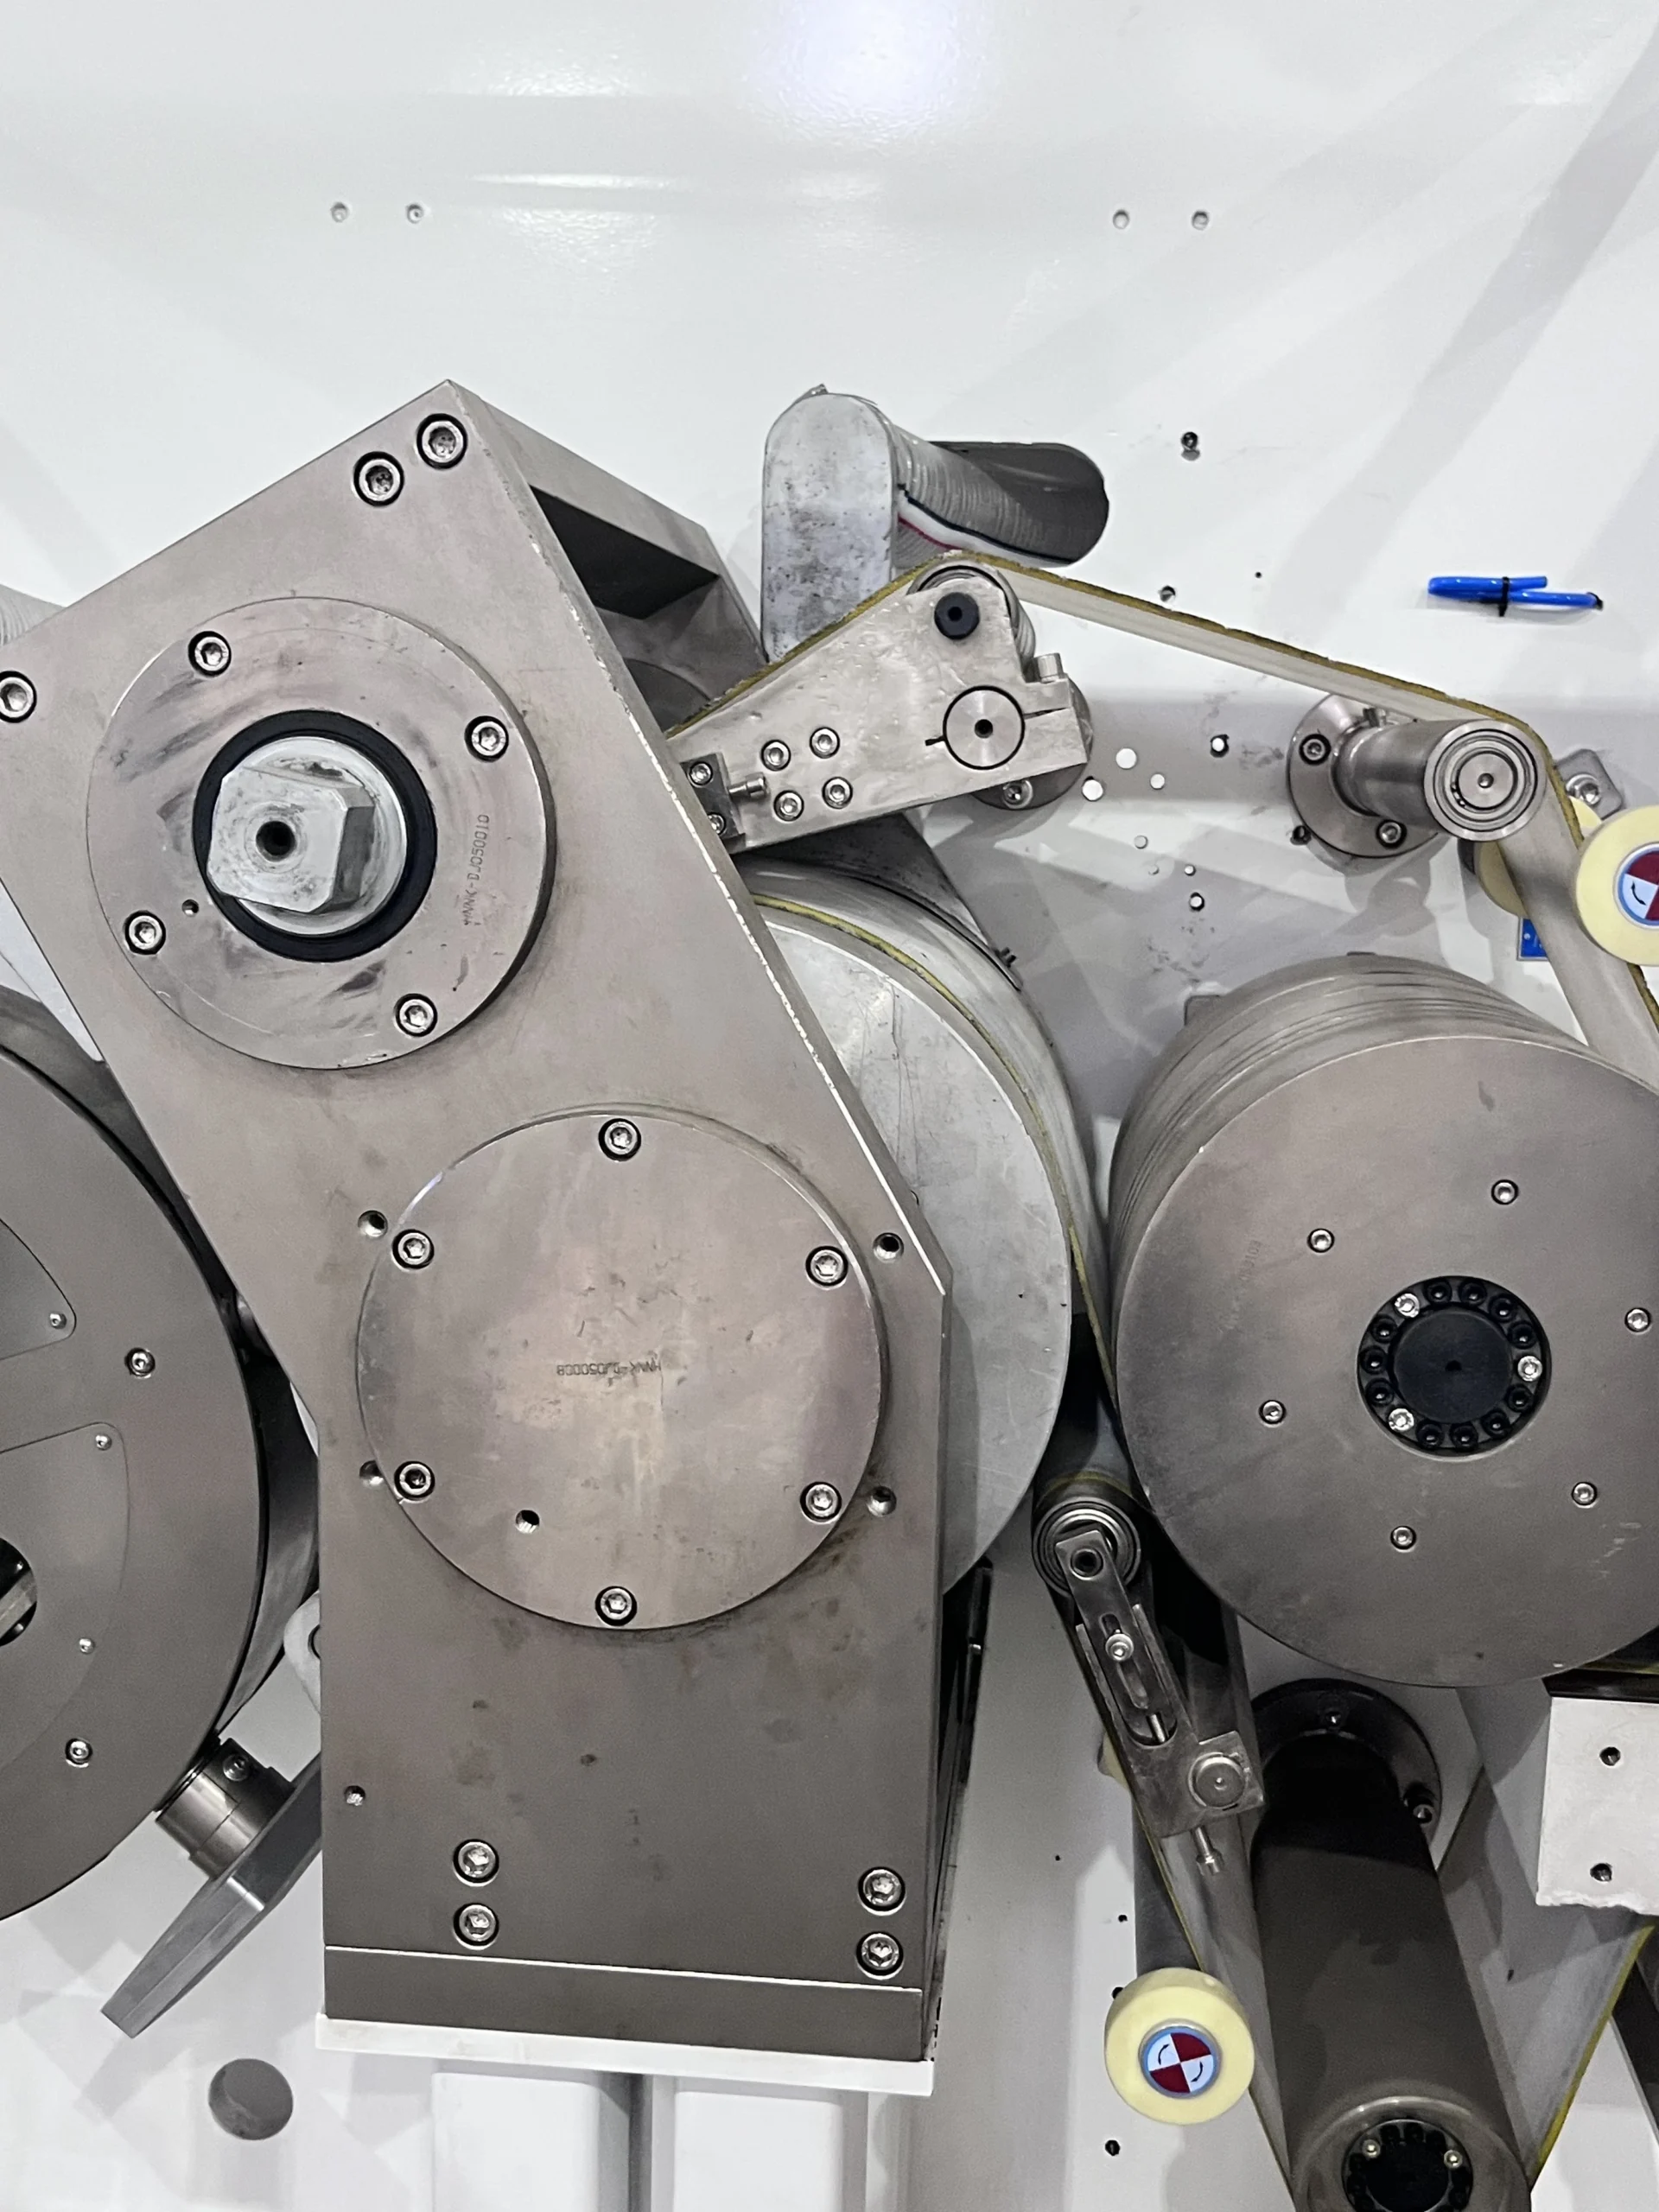
Quality loss is the difference between total units produced and units accepted at the agreed gate. Classify rejects by defect and operating phase: normal run, startup, restart, material splice or size change. A single waste percentage hides whether the problem belongs to process stability or changeover recovery.
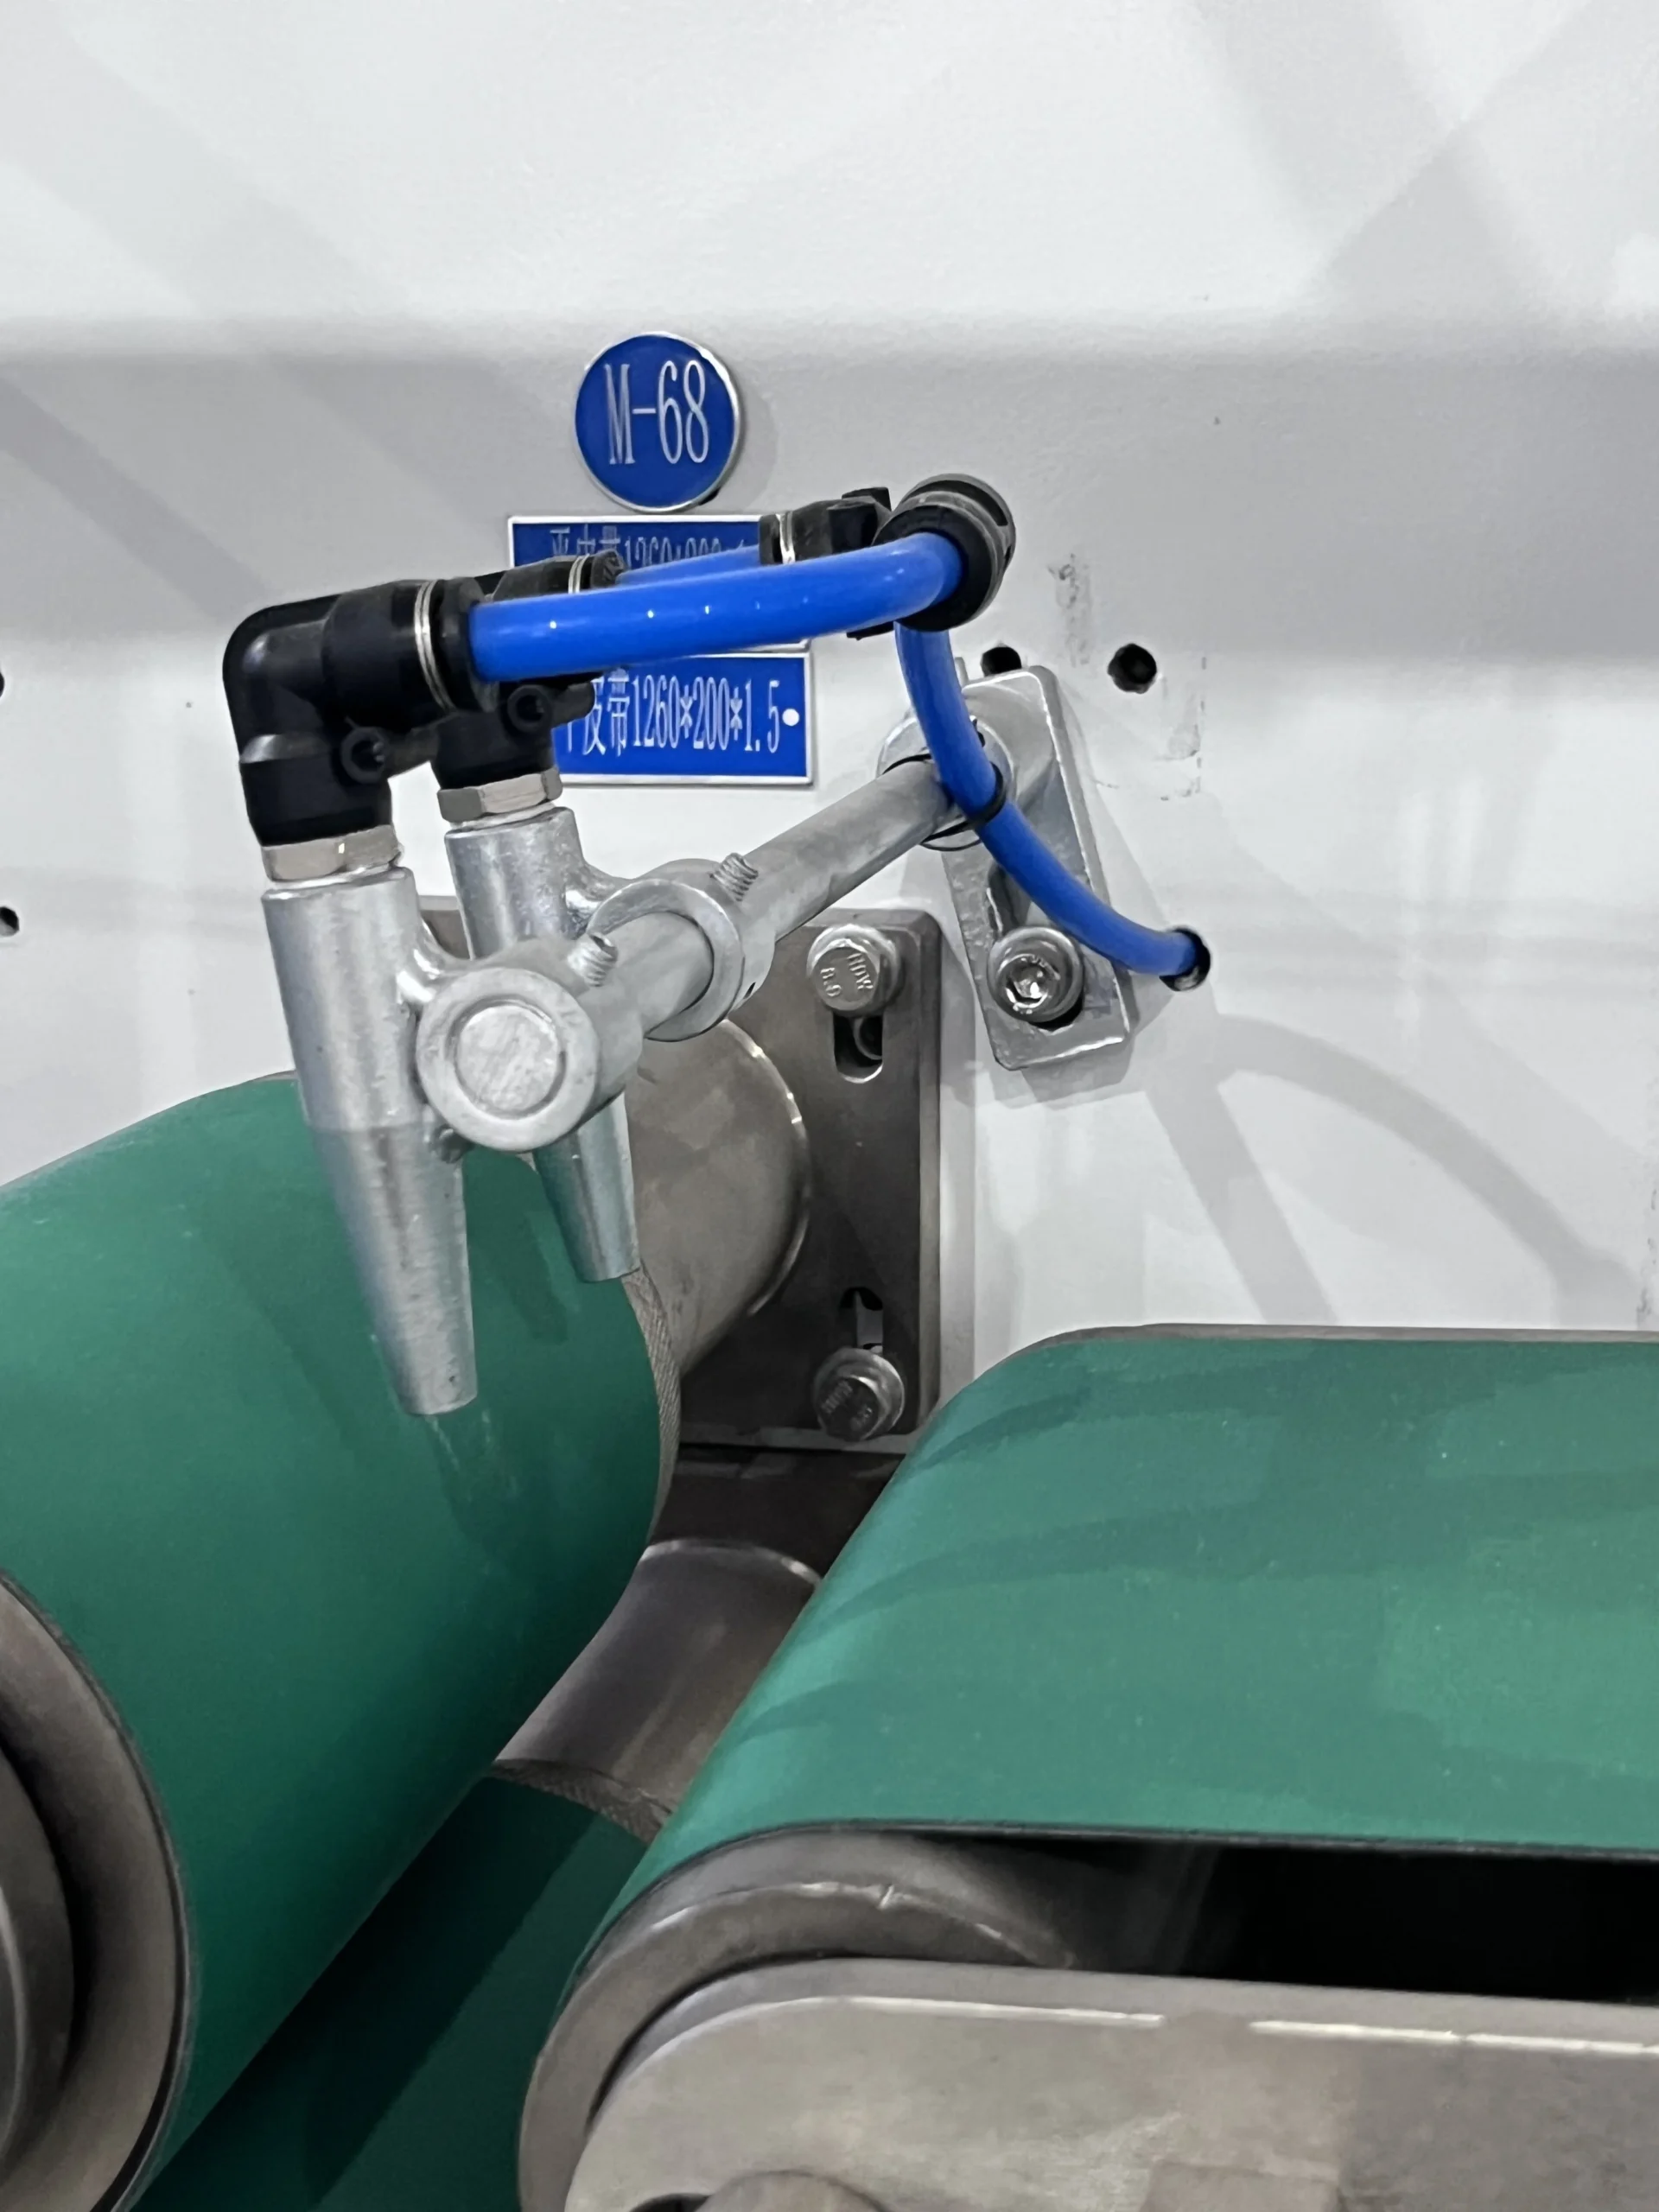
The real question is whether accepted products leave the end of line at the same rhythm. Record stacker waits, bag shortages, manual handling, full buffers and blocked discharge separately. Packing is not a footnote. It is the last capacity boundary before a good product becomes a sellable packed product.
A worked OEE decomposition that reconciles to 24,000 pieces per hour
Illustrative example only. The percentages and benchmark below are created solely to show how a combined qualified-output figure can be decomposed. They are not performance claims for any Welldone line.
Assume the approved gross benchmark for one SKU is 30,000 pieces per scheduled hour. The shift record shows 90% availability, 95% performance and 97% quality. Standard OEE is therefore 82.94%. A separate packing release factor of 96.5% brings end-to-end output to approximately 24,010 qualified packed pieces per scheduled hour.
| Layer | Illustrative factor | Output remaining | What to investigate |
|---|---|---|---|
| Gross benchmark | 30,000 pcs/scheduled hour | 30,000 | Validated SKU and material boundary |
| Availability | 90.0% | 27,000 | Stops, waiting and changeovers |
| Performance | 95.0% | 25,650 | Reduced speed and micro-stops |
| Quality | 97.0% | 24,881 | Defects, startup and restart rejects |
| Packing release | 96.5% | 24,010 | Stacking, bagging, buffers and labor |
This decomposition does not solve the 7,731-piece hourly gap by itself. It shows which layer owns each part of the loss. Management can then test recoverable hours and output before approving another shift, retrofit or production line.
Build one loss sheet by shift and SKU
Daily averages conceal changeover and product-mix effects. Use one row per shift and SKU, then reconcile gross count, rejects and packed release. The first objective is not a perfect dashboard. It is a record that production, maintenance, quality and packing can all sign.
| Field | Required record | Output for the decision |
|---|---|---|
| Shift and SKU | Date, shift, size, BOM and pack format | Comparable operating condition |
| Availability | Planned time, runtime and coded stop minutes | Recoverable stopped hours |
| Performance | Approved benchmark, gross count and short-stop events | Speed-loss owner and station |
| Quality | Gross units, accepted units and reject classification | Defect loss by operating phase |
| Packing | Accepted units, packed units, blocked time and buffer state | End-of-line constraint |
The acceptance and ramp-up framework can supply the same discipline during FAT, SAT and early production. One definition should follow the project from supplier test to normal shift reporting.
Decision gate: recover capacity before buying capacity
The loss tree should end with four outputs: the constraint station, recoverable hours, recoverable qualified output and the unresolved capacity gap. If removing the largest verified loss closes the gap, another line is premature. If the gap remains after realistic recovery, the investment case becomes stronger.
Input from Part 1Required output, scheduled hours and current qualified packed output.
Decision added hereThe loss owner: availability, performance, quality or packing.
Output to Part 3Loss tree by SKU and shift, recoverable hours and unresolved gap.
Part 3 will use this result to test shift allocation, campaign length and changeover sequence. Hardware should enter the discussion only after operational recovery has a measured limit.
Why structure an OEE review with Welldone
Welldone approaches capacity from the finished product backward. The discussion links the product structure, material route, machine stations, quality gates and packing boundary to one accepted-output definition.
The value of an OEE review is not the percentage displayed on a dashboard. It is the decision record beneath it: which station lost time, which SKU was running, what recovery was attempted and whether the lost output can be recovered without changing the machine scope.
Related machinery planning routes
Conclusion: one percentage is not a bottleneck analysis
OEE becomes useful when it explains the output gap. Availability identifies lost runtime, performance identifies lost pace, quality identifies rejected output, and the packing record shows whether good products actually reach a sellable format.
If your best shift repeated for an entire month, would it close the capacity gap calculated in Part 1? If yes, the next problem is how to reproduce that shift. If no, the remaining gap belongs in the retrofit-versus-new-line decision.
FAQ
Should packing be included in OEE?
Only if the agreed OEE boundary ends after packing. If OEE ends at the main-line quality gate, record packing as a separate release factor to avoid hiding the actual constraint.
Can I multiply qualified packed output by OEE?
No. Qualified packed output already contains upstream losses. Applying OEE again would double-count them. Decompose the number or start from a validated gross benchmark.
What is the minimum useful reporting interval?
Record by shift and SKU. A monthly average can hide frequent changeovers, difficult materials and one packing configuration that repeatedly limits output.
Which loss should be fixed first?
Start with the largest verified constraint that has a practical countermeasure. Duration alone is not enough; frequency, defect impact and recovery feasibility also matter.
When does a new line become justified?
When sustained demand remains above qualified capacity after realistic operational recovery, and materials, labor, utilities, packing and warehouse flow can support the added output.
Turn your diaper output gap into a station-by-station loss tree.
Website: www.cnwelldone.com | Email: welldone@cnwelldone.com
Discuss your OEE and bottleneck record