Diaper Line Capacity: Rated Speed vs Real Annual Output

Diaper Line Capacity: Why a 600 pcs/min Machine Does Not Produce 600 pcs/min
A factory owner showed me his capacity calculation before signing. Rated speed times minutes times shifts times working days. The number justified the investment comfortably. A year later his actual output was roughly two thirds of it, and he wanted to know which part of the machine was underperforming.
None of it was. The calculation was. This article breaks annual capacity into the four layers that actually determine it, using figures published on our own specification sheets, so you can size a line against reality rather than against a single number.
Baby Care Series · Part 3
Part 1: T-Shape vs 3-Piece Pull-Up — choosing the product format.
Part 2: SAP to Fluff Ratio — what goes inside the core.
Part 3 — what the line actually produces once it is running.
Part 1: T-Shape vs 3-Piece Pull-Up — choosing the product format.
Part 2: SAP to Fluff Ratio — what goes inside the core.
Part 3 — what the line actually produces once it is running.
The Calculation Before Signing
The arithmetic that gets a machine purchase approved usually looks like this:
Rated speed × minutes per shift × shifts per day × working days = annual capacity
It is clean, it is fast, and it overstates reality by a wide margin. Not because anyone lied, but because each term in that equation quietly assumes something that does not hold in a working factory.
Rated speed is a ceiling measured under defined conditions. It is not a forecast, and it was never presented as one.
Two Speeds on One Sheet
Read a specification sheet carefully and you will often find two speed figures rather than one.
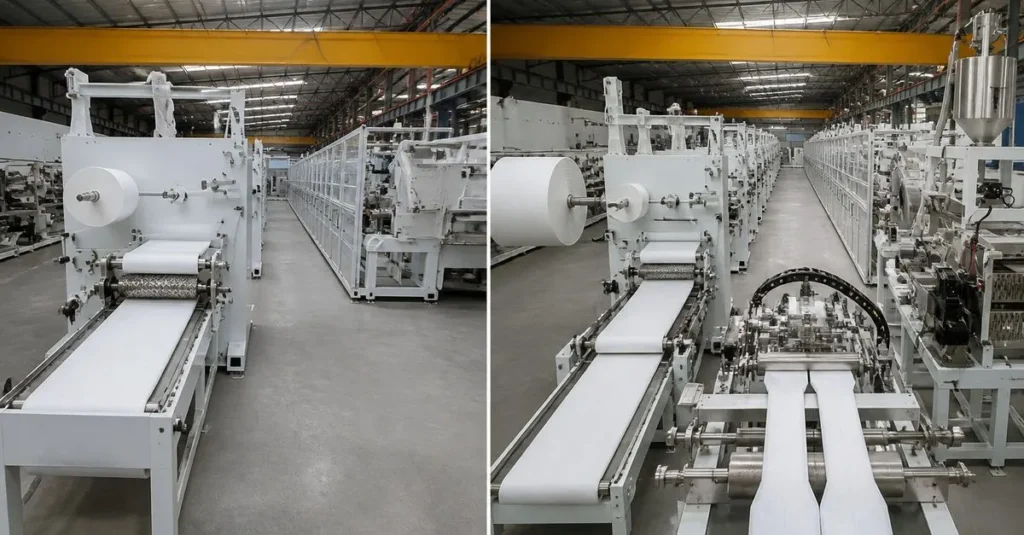
Our T-shape baby diaper line publishes a design speed of 600 pcs/min and a stable speed of 450-550 pcs/min. Both figures are on the same page. Both are accurate.
Design speed is what the machine is engineered to reach — the mechanical and servo capability. Stable speed is what it sustains in continuous production, running real materials, with normal variation in incoming rolls.
Multiply your business case by 600 when the line runs at 500, and you have built roughly a 17% error into the plan before delivery. The machine will meet its specification exactly. The plan will not.
Speed Is an Operator Decision
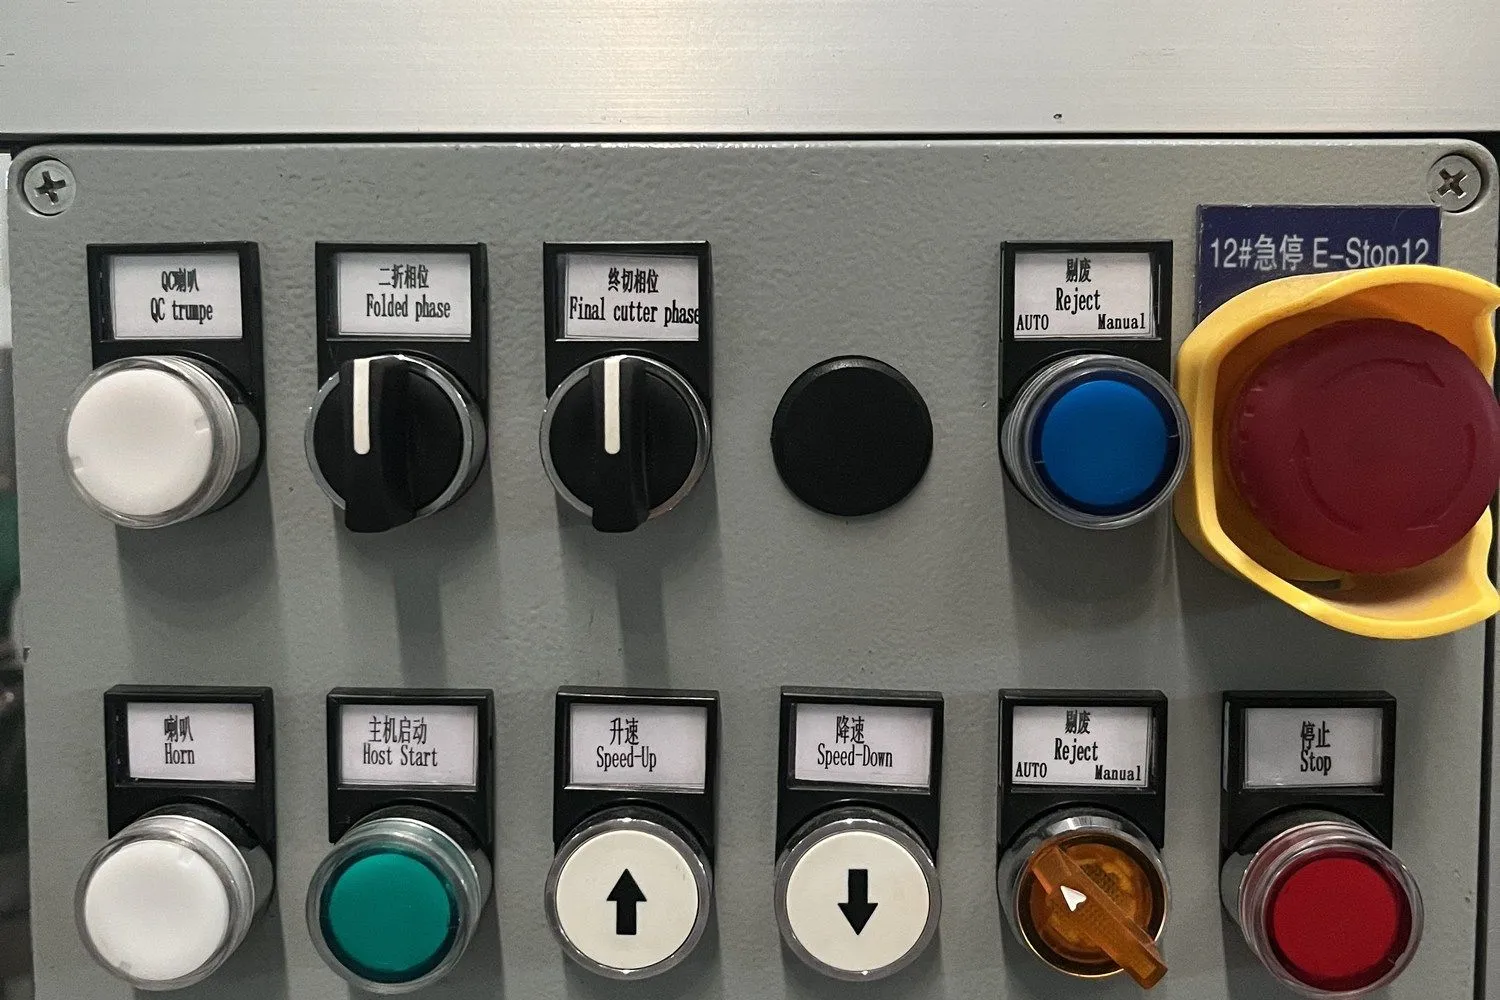
This photograph explains more about real output than any specification table.
Speed is not set once at commissioning. An operator raises and lowers it during the shift, responding to how the material is behaving, whether the reject rate is climbing, how a new roll is running. When something looks unstable, the sensible response is to slow down.
That means your average running speed is the outcome of hundreds of small decisions across a year, made by people who are — correctly — prioritising stable production over hitting a number on a sheet.
An operator who has run the line for three years will hold it closer to the upper end of the stable range. A newly trained team will not. That difference is training and experience, not machine capability.
The Four-Layer Calculation
A realistic capacity figure needs four terms, applied in sequence.
| Layer | What It Is | What It Removes |
|---|---|---|
| 1. Sustained speed | Stable speed, not design speed | The gap between peak capability and continuous running |
| 2. Availability | Share of scheduled time actually running | Changeovers, roll changes, splices, breakdowns, start-up |
| 3. Yield | Share of produced pieces that are saleable | Rejects, waste, start-up scrap |
| 4. Demand fit | Share of saleable output you can sell | Capacity produced in the wrong size or at the wrong time |
Layers 1 to 3 are the standard components of OEE. Layer 4 is the one that gets left out of engineering discussions and then decides whether the investment pays back.
Layer 2: Availability
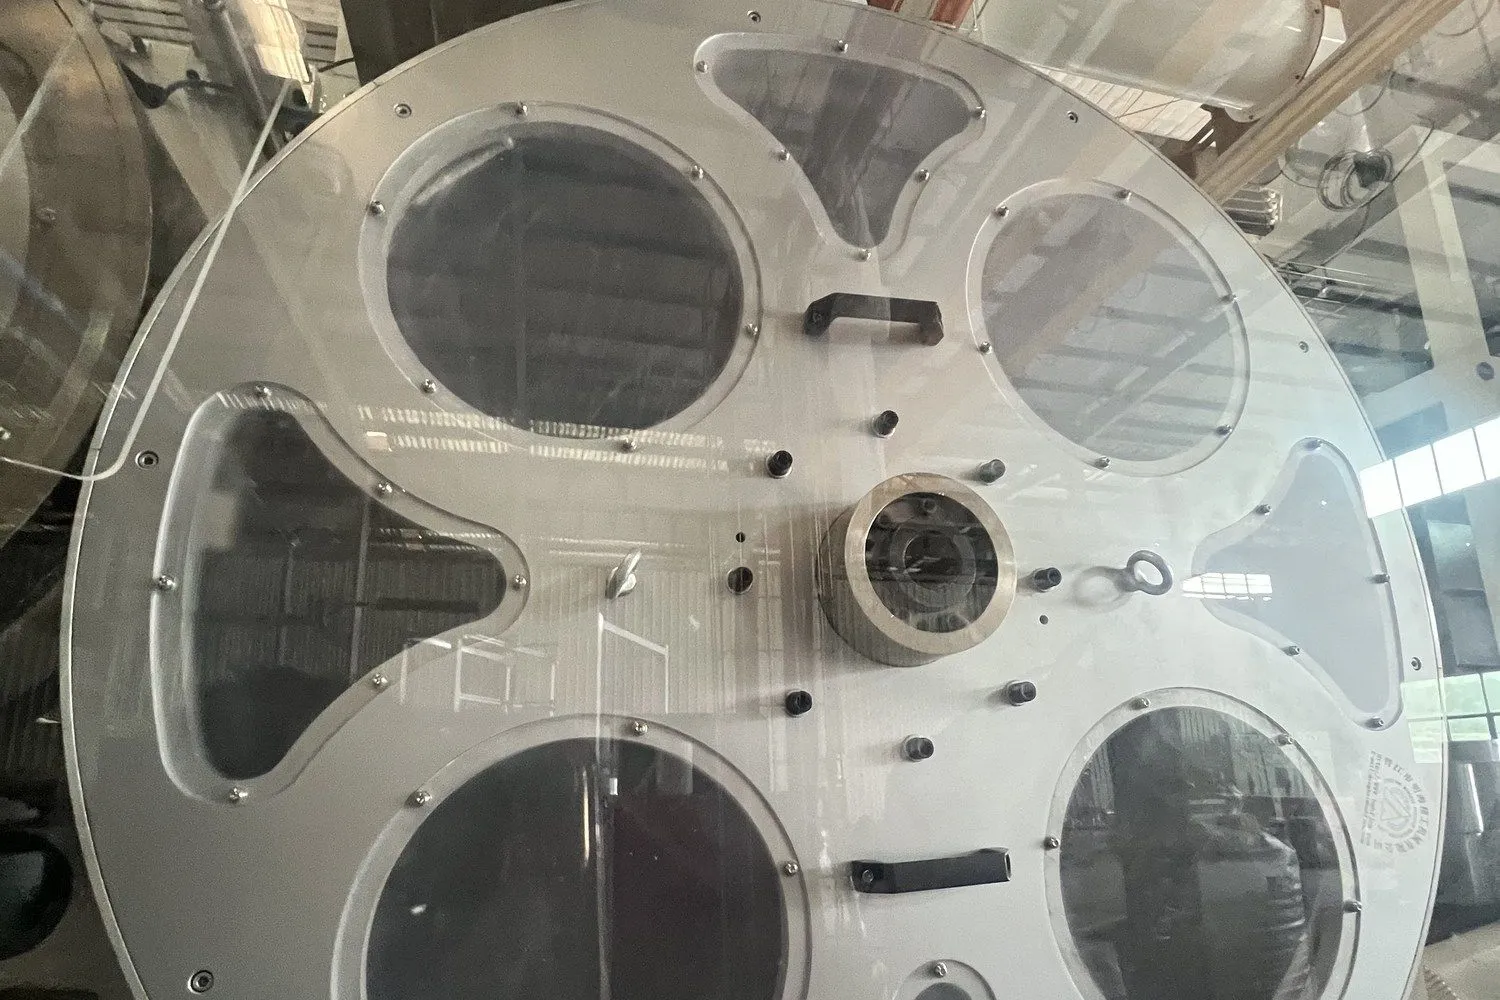
A converting line has many stations in series. The line produces only when every one of them is working. That is why availability is lower than most buyers expect: individual station reliability compounds unfavourably across a long line.
The recurring consumers of scheduled time are predictable:
- Size changeovers. The more size codes in your range, the more often the line stops. This is where the size ladder decision from Part 1 reappears as a capacity cost.
- Material roll changes. Every substrate runs out. Automatic splicing reduces the stop but does not remove the event.
- Start-up and shutdown. The first minutes of a shift are not at running speed, and the last minutes are spent clearing.
- Unplanned stops. Web breaks, glue faults, sensor issues. Individually short, collectively significant.
- Planned maintenance. Scheduled and necessary, but still time the line is not producing.
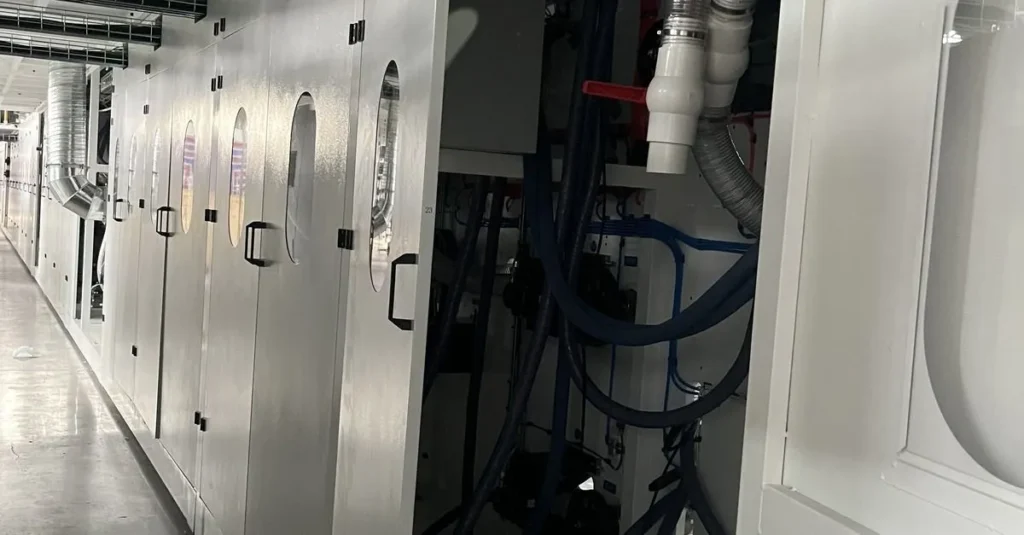
Note that our T-shape specification quotes a working space of 39m × 9m × 5m and 8-10 operators. Both figures tell you something about availability: a long line has many stations, and a team of that size exists because there is continuous intervention to be done.
Layer 3: Yield and What It Excludes
Our published passing rate is at least 98%, with waste below 2%. Read the qualifier that follows it on the same sheet: not including the glue applicator and auto splicing.
That qualifier is not evasion — it is standard practice, because those components are typically supplied by third parties and their performance depends on materials and settings outside the line builder's control. But it does mean the 98% figure describes the converting machine, not the complete production system.
Your realised yield is the machine figure minus whatever those excluded components contribute, minus start-up scrap at every changeover, minus anything rejected downstream at packaging.
In most cases the difference is a few percentage points. On an annual volume, a few percentage points is a large number of pieces.
Detection Is Not Free
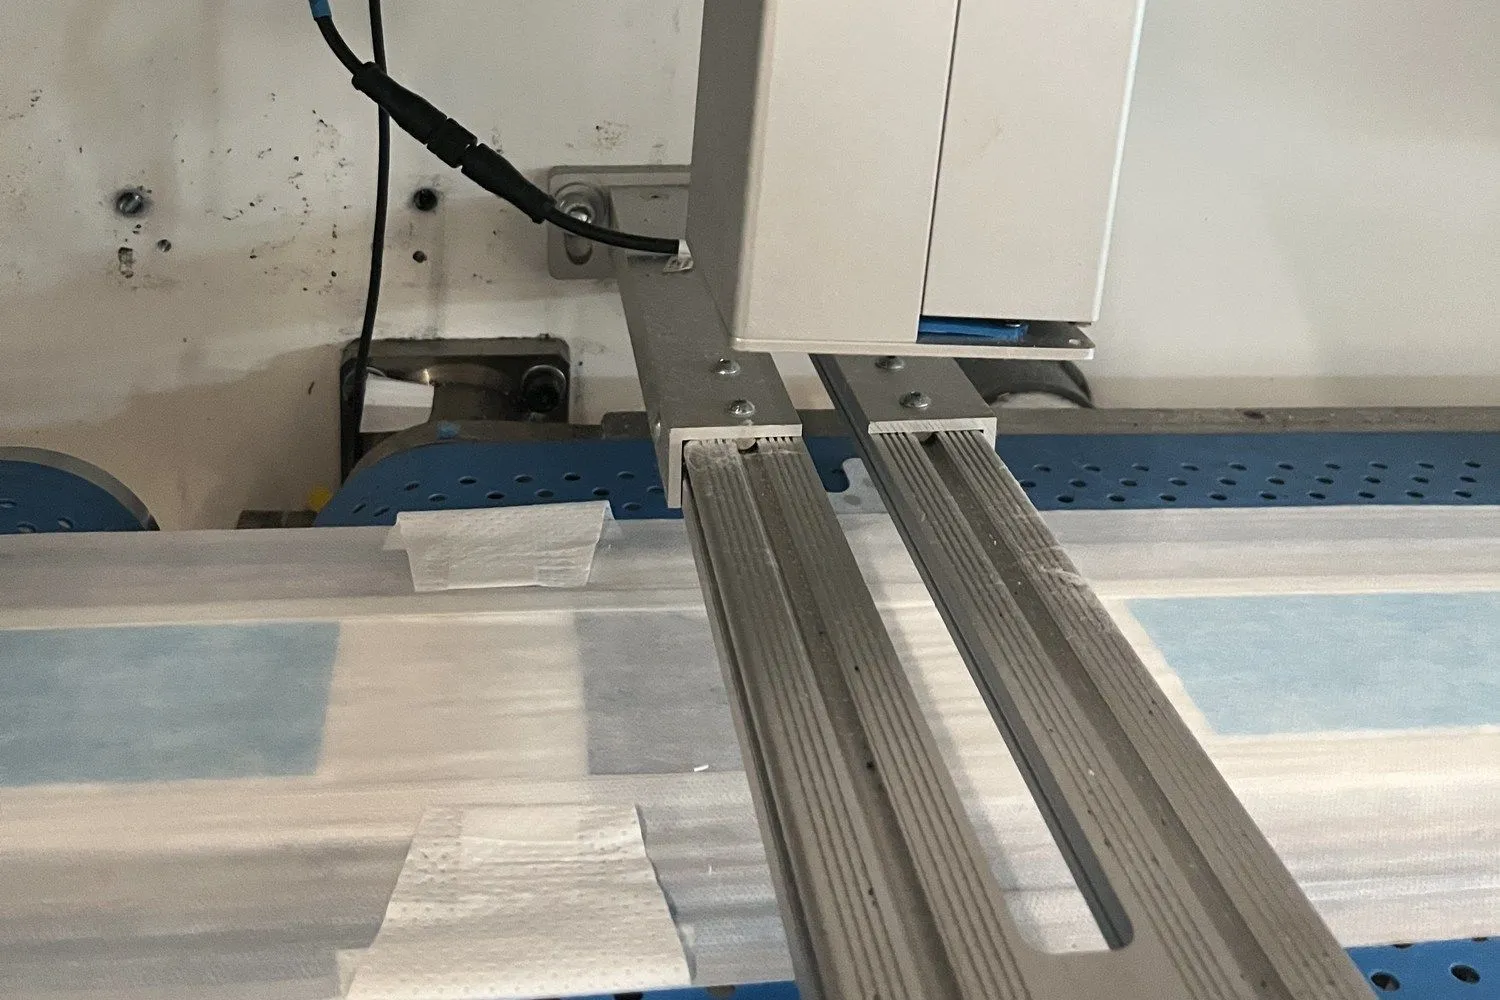
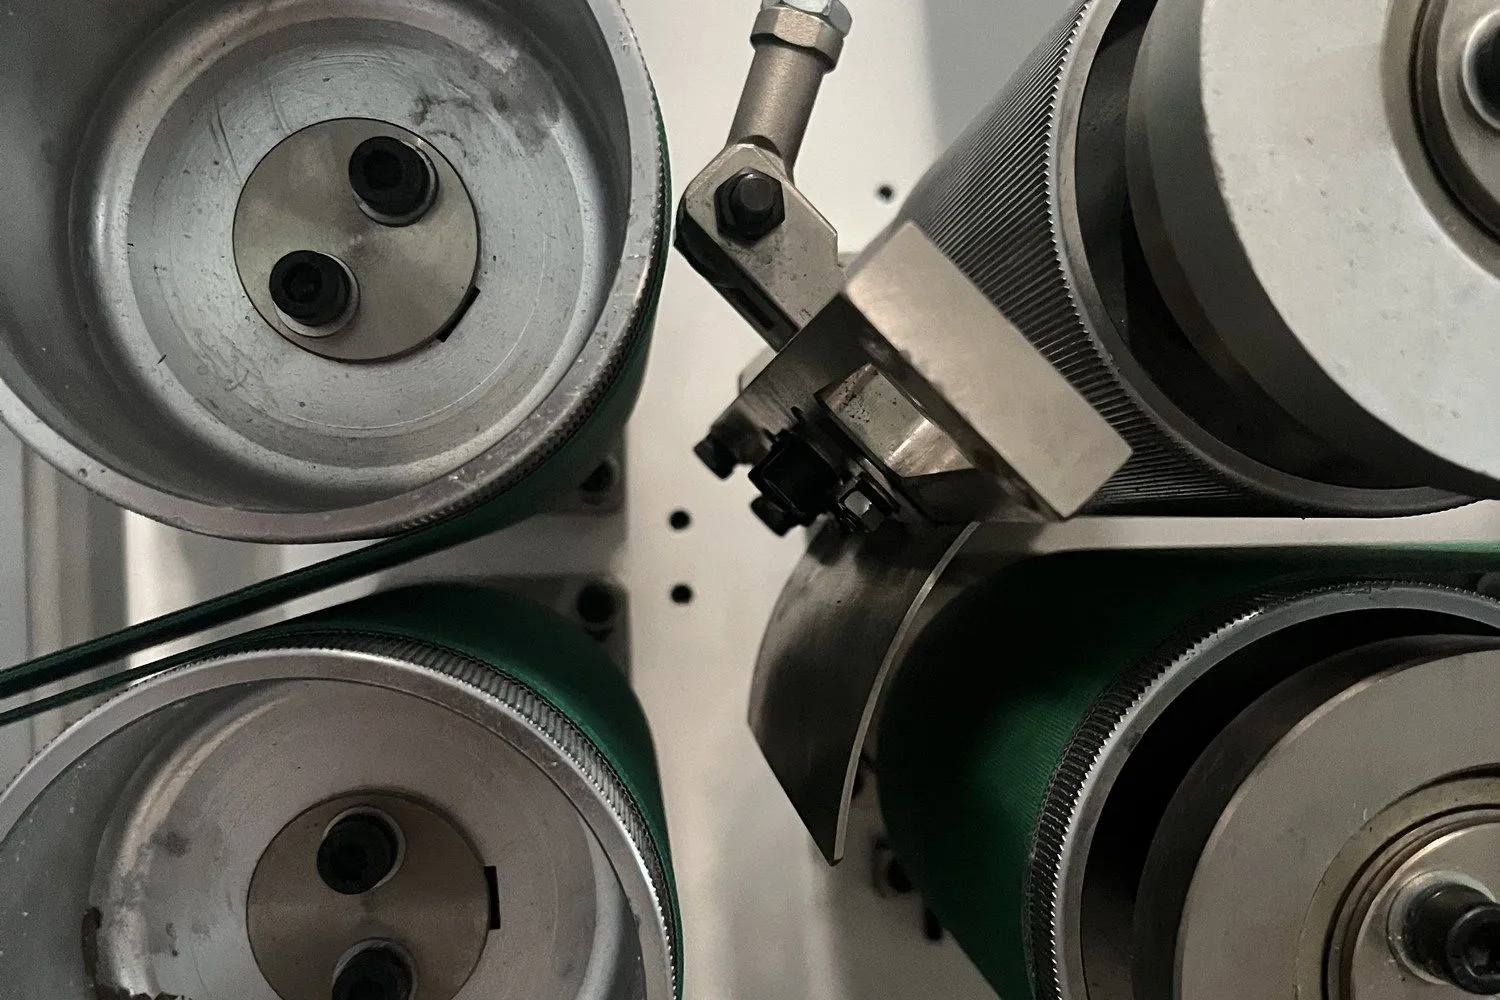
Inspection and rejection are essential, and they are also worth understanding correctly when reading production data.
A rising reject count does not mean the inspection system is failing. It usually means it is working exactly as intended while something upstream has drifted. The machine is doing its job by removing product your customer should never see.
But every rejected piece consumed full material and full machine time. It occupied a cycle that could have produced a saleable unit. So detection protects quality and consumes capacity at the same time — which is why the useful metric is not how many defects you caught, but why they were created.
When reject rates climb, the productive question is what changed in the material, the glue, or the settings, rather than whether the sensor threshold should be relaxed.
Worked Example
Illustrative calculation. Speed and yield figures are taken from our published T-shape specification. Availability and demand-fit values are placeholders to demonstrate method — substitute your own measured data before drawing conclusions.
| Step | Calculation | Result |
|---|---|---|
| Naive figure | 600 pcs/min × 60 × 20 h × 300 days | 216 million pcs |
| Layer 1 — sustained speed | Use 500 pcs/min instead of 600 | 180 million |
| Layer 2 — availability | × 0.85 (illustrative) | 153 million |
| Layer 3 — yield | × 0.97 (illustrative, after excluded components) | ≈ 148 million |
| Versus naive figure | 148 ÷ 216 | ≈ 69% |
Roughly two thirds of the headline number — which is close to what the factory owner in the opening actually experienced.
Nothing was wrong with his machine. Every term he omitted was documented or knowable. The error was structural: he multiplied a ceiling by time and called it a forecast.
Working out whether a line can meet your volume target?
Send us your target annual output, planned size range and shift pattern. We will work backwards to the speed tier and configuration you need — including telling you when a smaller line run well beats a larger one run badly.
Where the Time Actually Goes
If you already run a line and want to find your own availability figure rather than assume one, log these five categories for two weeks. Most factories are able to do this with a paper sheet and a clock.
| Category | What to Record | Typically Underestimated Because |
|---|---|---|
| Size changeover | From last good piece to next good piece | Only the mechanical adjustment gets timed, not the verification run |
| Roll change and splice | Every stop, however short | Individually trivial, collectively hours per week |
| Unplanned stop | Duration and cause | Short stops are often not logged at all |
| Speed reduction | Time spent below target speed | The line is running, so it does not feel like lost time |
| Start-up and clearing | Per shift | Treated as fixed overhead rather than measured |
The fourth row is the one that surprises people. A line running at 380 pcs/min for two hours has lost as much output as a 24-minute stop, but nothing appeared in the downtime log because the machine never stopped.
Buying Speed You Cannot Use
There is a mirror-image error worth naming, because it costs money in a different direction.
Buyers who have been burned by an optimistic calculation sometimes overcorrect and specify a much faster line as insurance. That has consequences of its own.
- A faster line consumes material faster. Roll changes become more frequent, so availability can fall rather than rise.
- Downstream must keep up. If your packaging section cannot absorb the output, the constraint simply moves — the same logic described in our packaging line speed article.
- Capital is committed early. Capacity bought now and used in year four is capital that could have funded a second line when demand was proven.
- Complexity rises with speed. Higher speeds tighten tolerances on materials and on operator competence.
A common mistake is treating headroom as free. It is a purchase like any other, and it should be justified by a demand forecast rather than by anxiety about the last calculation.
How to Size Honestly
Work backwards from what you need to sell rather than forwards from what a machine can do.
- Start with annual sales volume, not machine capability. What do you realistically expect to sell in years one, two and three?
- Divide by realistic working time, using your actual shift pattern and holiday calendar rather than theoretical maximums.
- Apply availability and yield from your own measurement if you have an existing line, or from conservative assumptions if this is your first.
- Add headroom for growth you can evidence, not for growth you hope for.
- Check the size range separately. More size codes means more changeovers, which lowers availability regardless of speed.
- Confirm downstream capacity before finalising, so the constraint does not simply relocate.
The output of this exercise is a required speed tier. Compare quotations against that figure rather than against each other.
Why Welldone
We have manufactured hygiene product machinery in Jinjiang, Fujian since 2008 and delivered to more than 60 countries. Our specification sheets publish both design speed and stable speed because a buyer who plans against the wrong one ends up disappointed in a machine that met its specification.
Two speeds, statedDesign speed and stable speed appear on the same sheet, along with passing rate, waste rate and what those figures exclude.
Sized from your volumeWe ask for your target annual output and size range, then work backwards to the speed tier — including recommending a smaller line where that fits better.
Verified with your materialsVideo factory acceptance test at rated speed using your substrate specification, so you see the line running your materials before shipment.
Related Machines
Conclusion
Rated speed is a real figure that answers a narrow question: what can this machine do under controlled conditions. Annual capacity answers a different question, and it needs sustained speed, availability, yield and demand fit to arrive at an honest number.
The gap between the two is not a supplier problem or a machine problem. It is what happens when a ceiling is mistaken for a forecast.
So before your next capacity calculation: do you know your line's actual average running speed across a full month — or only the number printed on the specification sheet?
Frequently Asked Questions
What is the difference between design speed and stable speed?
Design speed is the mechanical and servo capability of the machine — what it is engineered to reach. Stable speed is what it sustains in continuous production with real materials and normal roll-to-roll variation. Our T-shape line publishes 600 pcs/min design speed and 450-550 pcs/min stable speed. Plan against the second figure.
What availability should we assume if we have no data?
Rather than adopting a benchmark figure, measure your own if you have an existing line — two weeks of logging changeovers, roll changes, unplanned stops and time spent below target speed will give you a more useful number than any industry average. For a first line, use a deliberately conservative assumption and tell us your size range, since changeover frequency is the largest single variable.
Why does the passing rate exclude the glue applicator and auto splicing?
Those components are typically third-party supplied and their performance depends on materials and settings outside the line builder's control. Excluding them is standard practice and stated openly on the specification. It does mean the figure describes the converting machine rather than the complete system, so allow for their contribution when calculating realised yield.
Does a faster line always produce more?
Not necessarily. Higher speed consumes material faster, so roll changes become more frequent and availability can fall. It also tightens tolerances on materials and operator competence. If downstream packaging cannot absorb the output, the constraint relocates rather than disappears. Speed only converts into output when the rest of the system supports it.
How much does the number of size codes affect capacity?
Materially, through changeover frequency. Each size change costs the time from last good piece to next good piece, including the verification run that is often not counted. A line running two sizes and a line running six can have very different realised output at identical rated speed. Decide your size ladder before sizing the machine.
What should we send you to get a realistic capacity assessment?
Target annual sales volume for the next three years, planned size range and pack formats, shift pattern and annual working days, existing line data if you have it, your downstream packaging capacity, and your material supply arrangements. The last two are the ones most often omitted and most often decisive.
Request a Capacity Sizing Review
Tell us the volume you need to sell rather than the speed you want to buy, and we will work backwards to the configuration that delivers it — including when a smaller line run well is the better investment. Please include:
- Target annual volume, years 1-3
- Planned size range
- Pack formats
- Shift pattern and working days
- Existing line data, if any
- Downstream packaging capacity
- Material supply arrangements
- Country and target markets