Sanitary Napkin Hidden Costs: 4 Items Missing from CAPEX

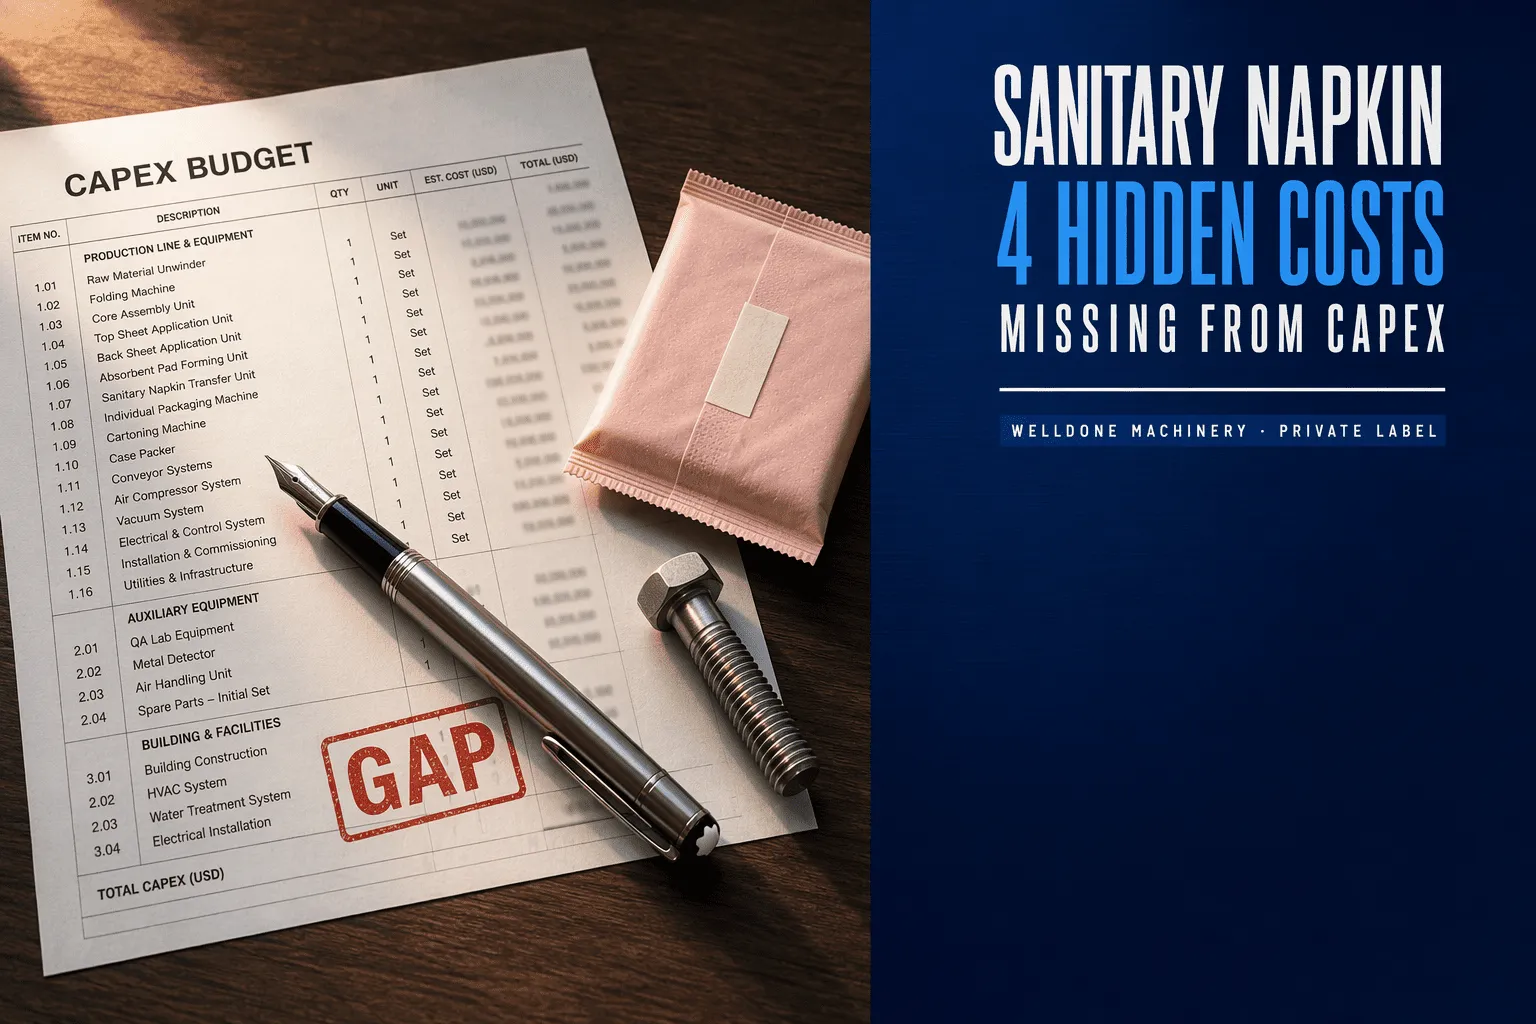
The 4 Hidden Cost Items on a Sanitary Napkin Line — All Missing from Your CAPEX Table
Every sanitary napkin CAPEX table is optimized around the equipment price. Every year-one P&L is decided by four operating cost items that never appeared on the CAPEX quote — and quietly eat 20 to 30% of the total operating cost buyers thought they had budgeted for. This is Part 2 of the Female Care series, and it walks through the four items line by line.
Part 1 of this series looked at SKU changeover time — the single specification that separates a servo line from a mechanical-cam line on a private-label program. This is the follow-up: the four operating cost items sitting outside the CAPEX table that decide whether your year-one P&L lands on plan, or 20 to 30% below it.
1 · The Egypt P&L that came in 6 points light
A private-label sanitary napkin factory in Egypt sent me their year-one P&L last month. Gross margin was 6 points below the business case the CFO had signed off on 14 months earlier.
The CAPEX table on the original business case was pristine — every equipment line item, every installation cost, every shipping quote, every commissioning fee. Nothing was over budget. The equipment supplier had delivered exactly what they had quoted.
The problem was the four operating cost items that never appeared on the CAPEX quote — because CAPEX quotes cover CAPEX. The four items eating the margin were all in the OPEX bucket, and every one of them was directly determined by which equipment specification the factory had accepted at the PO stage.
Add those four items and the picture stops being a CAPEX success story with an OPEX surprise. It becomes what it actually is: an incomplete business case. The supplier optimized to what the buyer measured. The buyer measured only the price on the invoice. Everything downstream was a rounding error until year-end.
2 · Hidden cost 1 · SAP loss at startup and changeover
Super-absorbent polymer is the single largest raw material cost on a sanitary napkin line — usually 35 to 45% of BOM. Nobody tracks it as a losable material in the CAPEX projection, because in a demo hall on a stable one-SKU run, SAP loss looks like a fixed 1%.
In a real factory running 4 to 6 SKUs across three shifts, SAP loss on a mechanical-cam line runs 4 to 7% of raw material spend. Most of that loss happens during three moments the demo hall never shows you: startup dosing calibration, mid-shift SKU changeover, and end-of-run purge before the next core weight parameter.
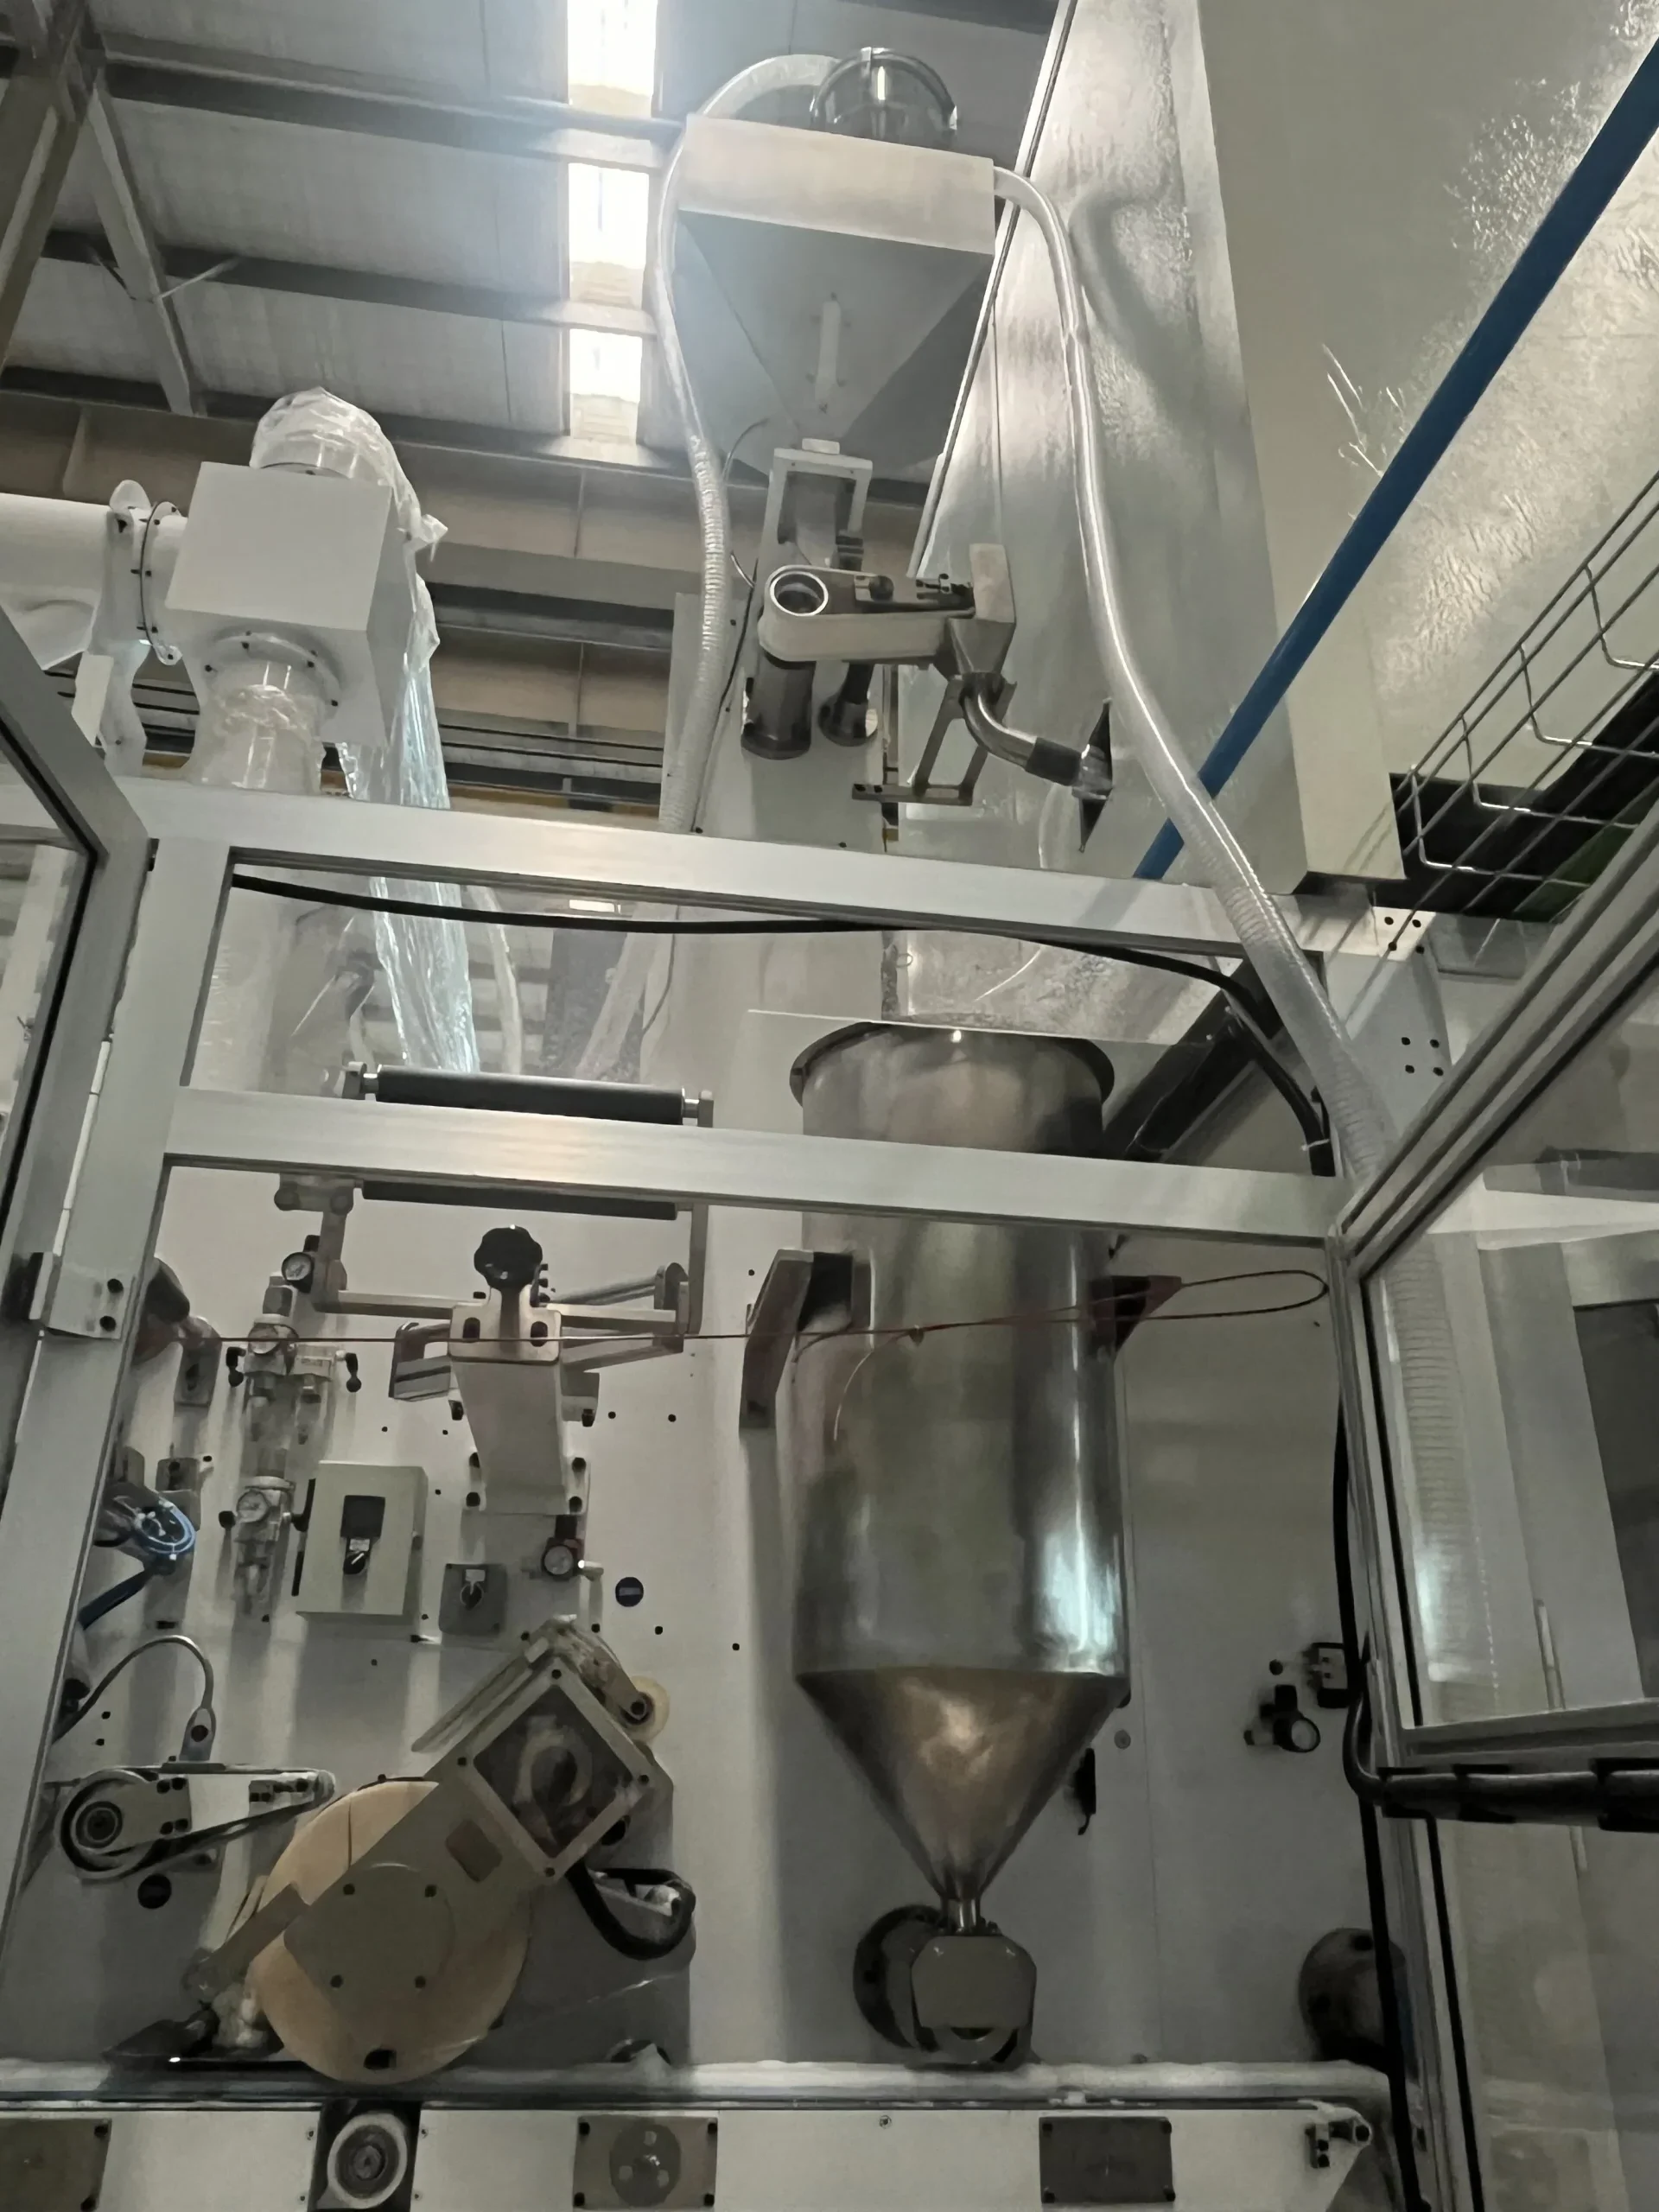
On a well-configured servo line with recipe HMI, the SAP dosing profile is a stored parameter set. There is no dosing calibration on SKU switch — the profile writes to the metering system in one operator touch. Real customer floor data shows SAP loss drops from 4 to 7% down to 1.5% on the same raw material at the same product weight. On a 300-million-piece annual line, that difference is USD 200,000 to 400,000 per year of SAP that quietly disappeared from your P&L without ever appearing as a stock discrepancy.
3 · Hidden cost 2 · Changeover labor with no operator invoice line
Labor cost on a sanitary napkin line is usually calculated as headcount times shift rate times shifts per year. What the CAPEX projection misses is the paid labor that produces nothing.
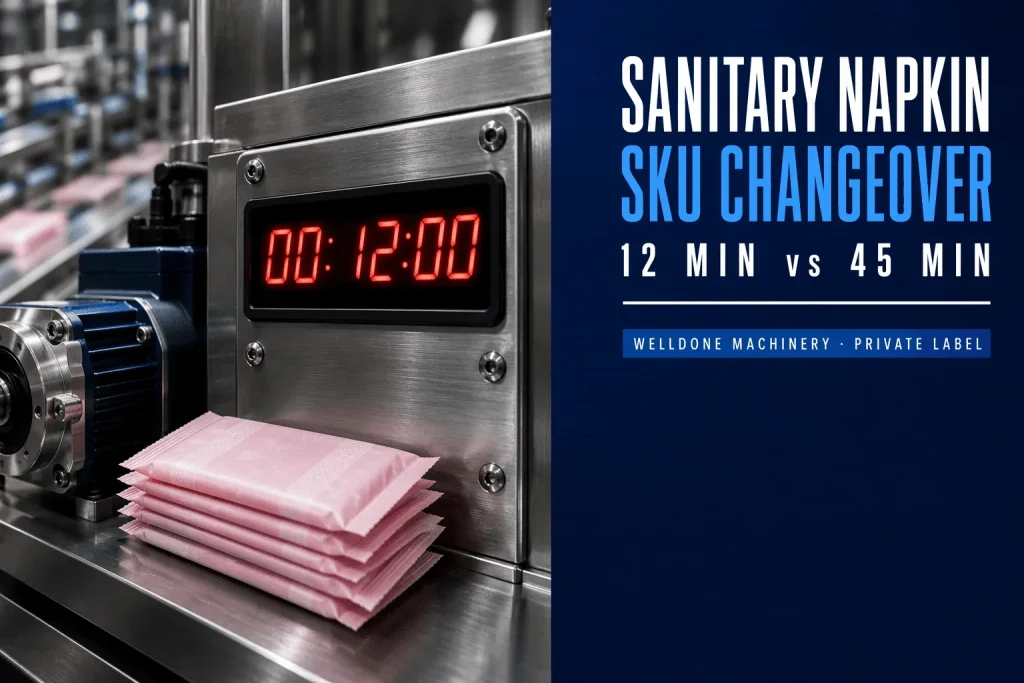
On a mechanical-cam line with 45-minute SKU changeovers: three operators stand idle for 45 minutes, three times per shift, three shifts a day. Over 300 working days, that is roughly 60,000 paid labor hours per year spent watching a stopped machine. At a fully loaded labor rate of USD 6 per hour, that is USD 360,000 the CAPEX table never mentioned.
A servo line with sub-15-minute changeovers cuts the same labor line to under 20,000 paid idle hours per year. The headcount on the roster is the same. The paid-idle line item is roughly a third. That difference — call it USD 240,000 — is not a cost saving. It is a cost the CAPEX table never budgeted for, showing up as an operating variance.
4 · Hidden cost 3 · Non-woven and film safety stock
The CFO sees this one every month, and nobody in the equipment procurement conversation ever mentions it. Working capital tied up in raw material inventory is real money, and the amount is decided by how much variability your line can absorb between raw material deliveries.
A legacy mechanical-cam line with unpredictable changeover times and manual splice cores needs 4 to 6 weeks of non-woven and film safety stock to run without stopping. A servo line with pre-loaded splice magazines and a recipe HMI runs safely on 2 weeks — because splice failure risk is engineered out, not managed around.
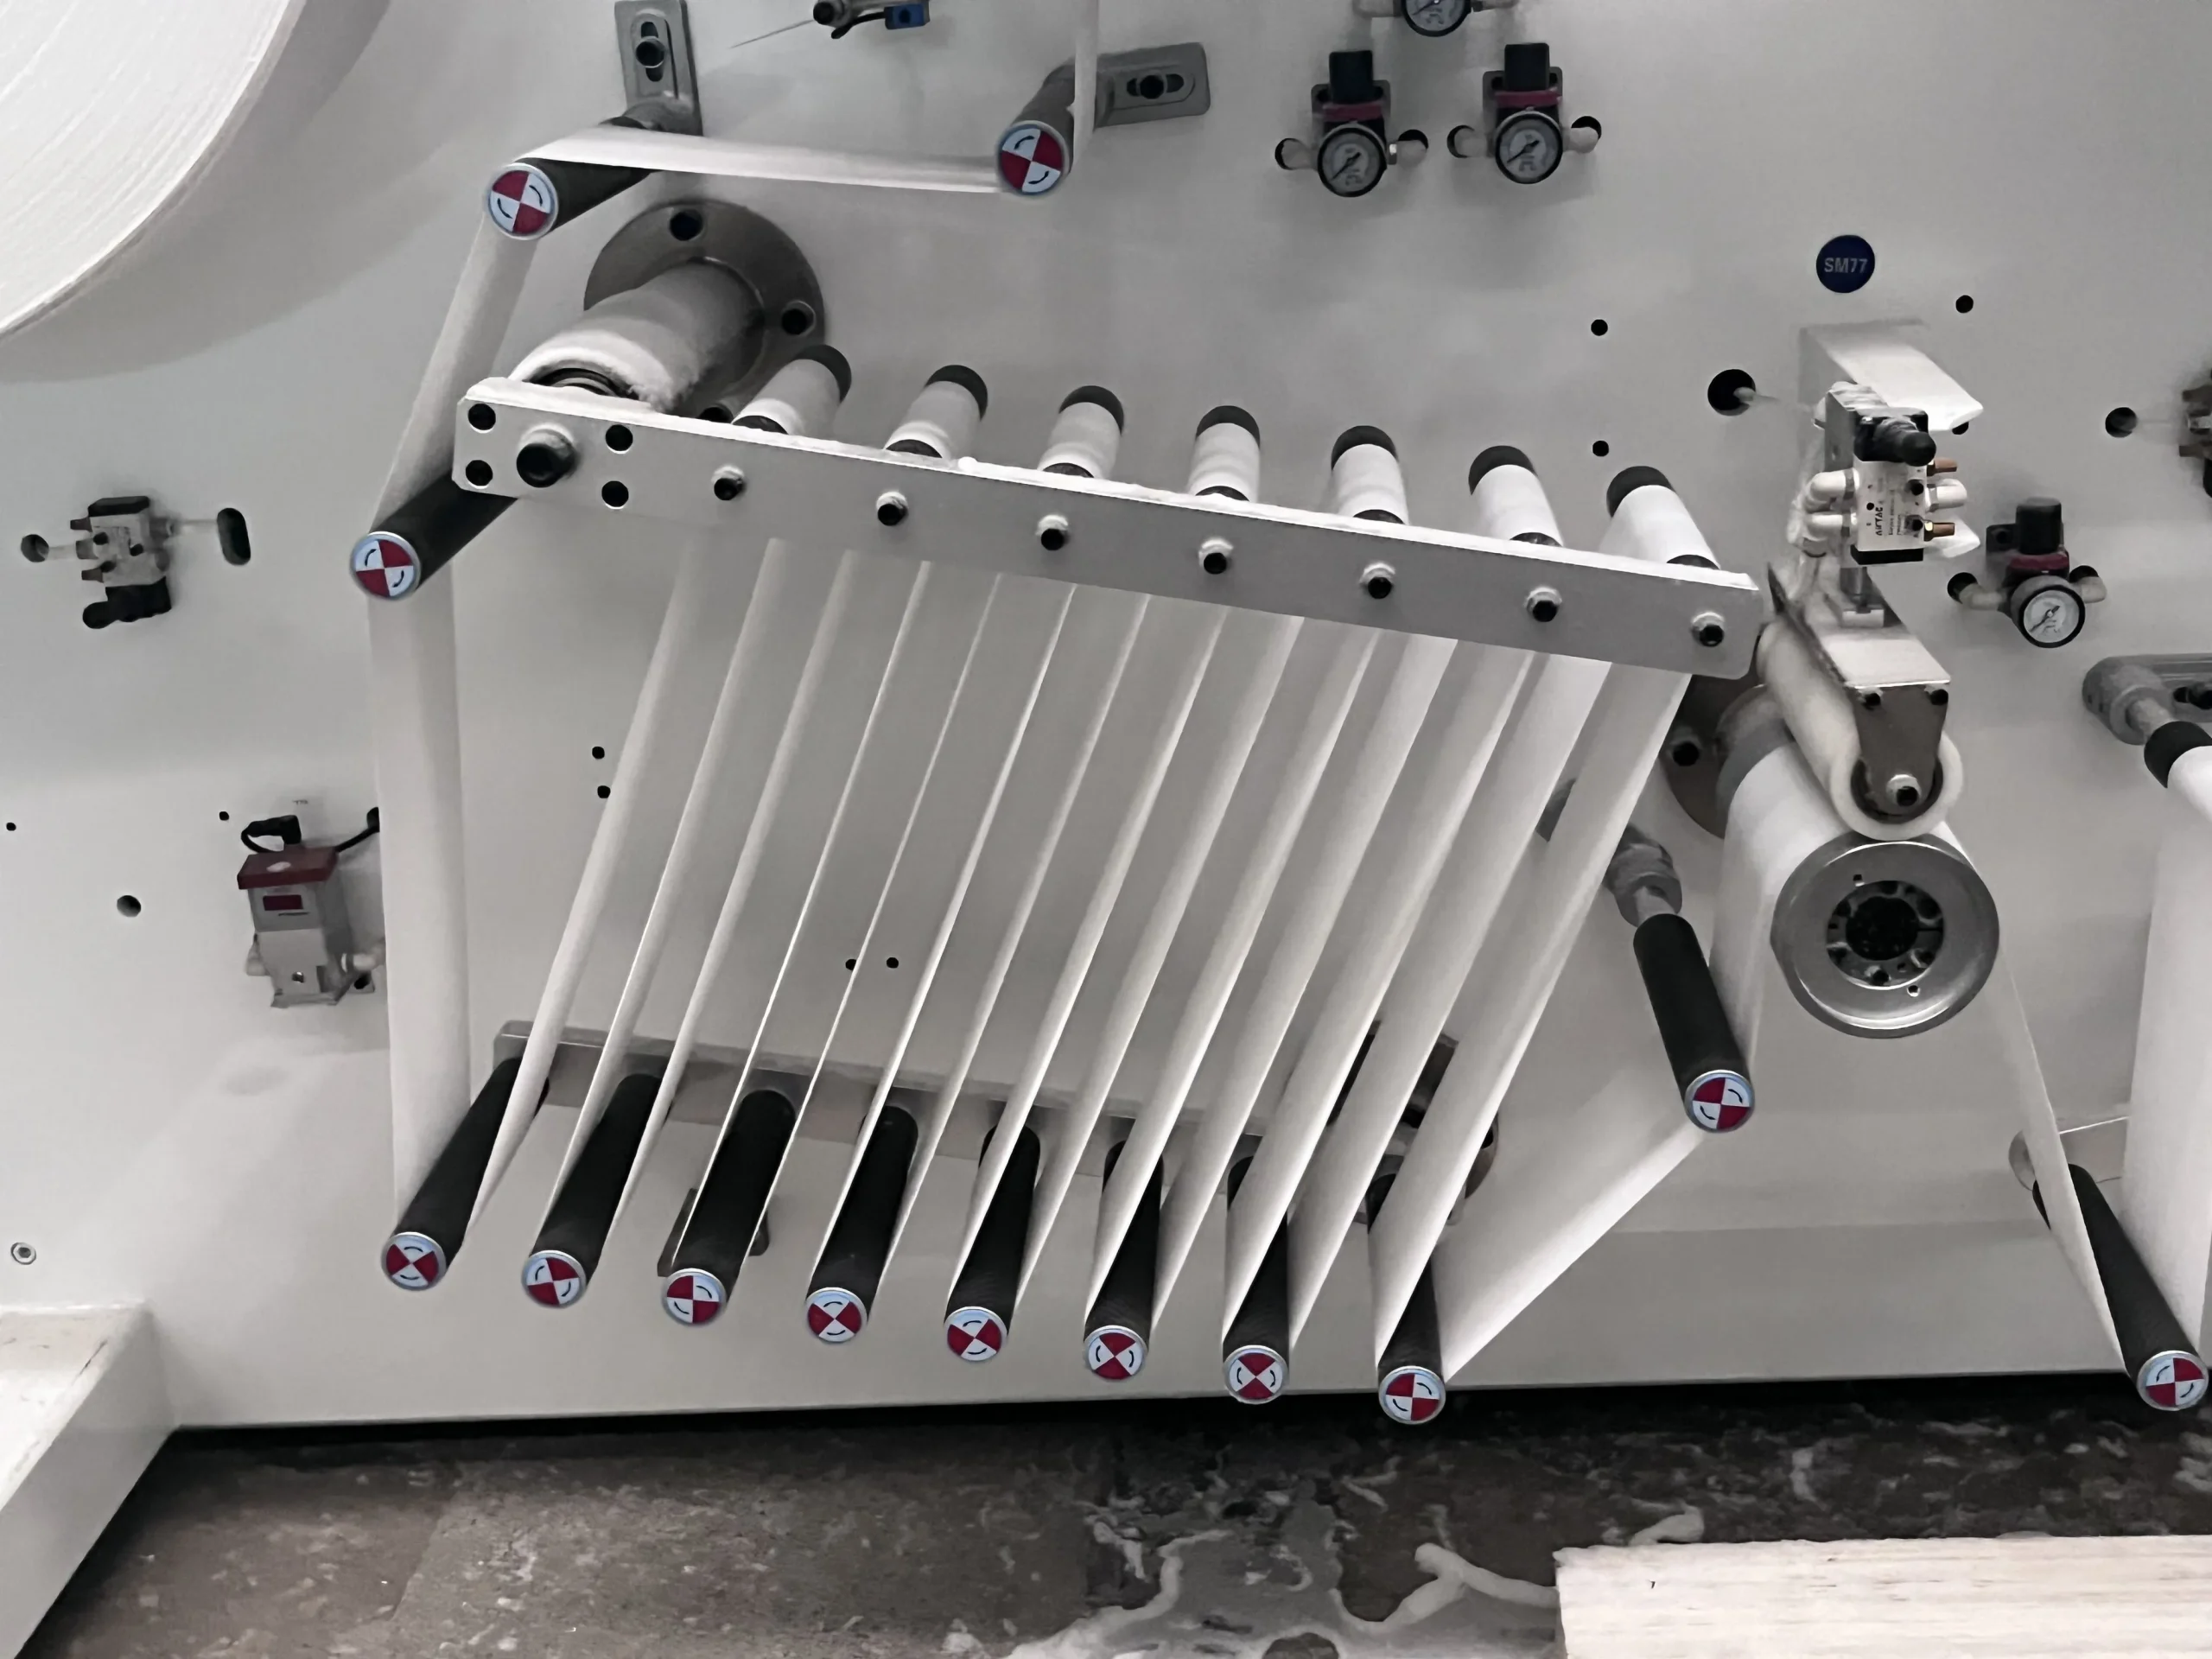
For a mid-size private-label factory, that difference is typically USD 400,000 to 700,000 of working capital freed up permanently on day one — and, more importantly, absent from the finance director's monthly working capital report from month two onward. It is money nobody put on the CAPEX projection, because nobody asks the equipment supplier about working capital efficiency. They should.
5 · Hidden cost 4 · Rework and downgrade line
Every sanitary napkin line produces some percentage of product that fails final inspection and either gets reworked or moves to a B-grade / scrap bucket. What the CAPEX projection assumes is 0.3% — the number a supplier quotes when their line runs one SKU in a demo hall.
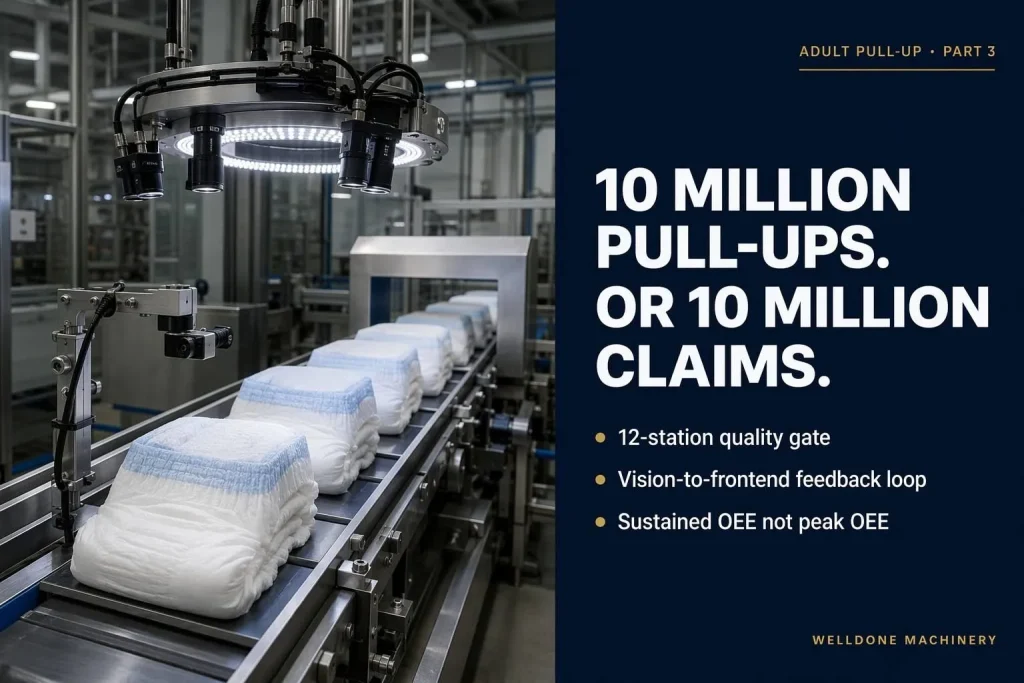
Real production data across the private-label programs I have audited shows something different. On a well-matched servo line with in-line vision and closed-loop feedback: 0.3 to 0.5% is achievable and sustainable. On a poorly matched line — meaning the machine, the raw materials, and the SKU envelope were specified in isolation — outgoing defect rate runs 0.8 to 1.5%.
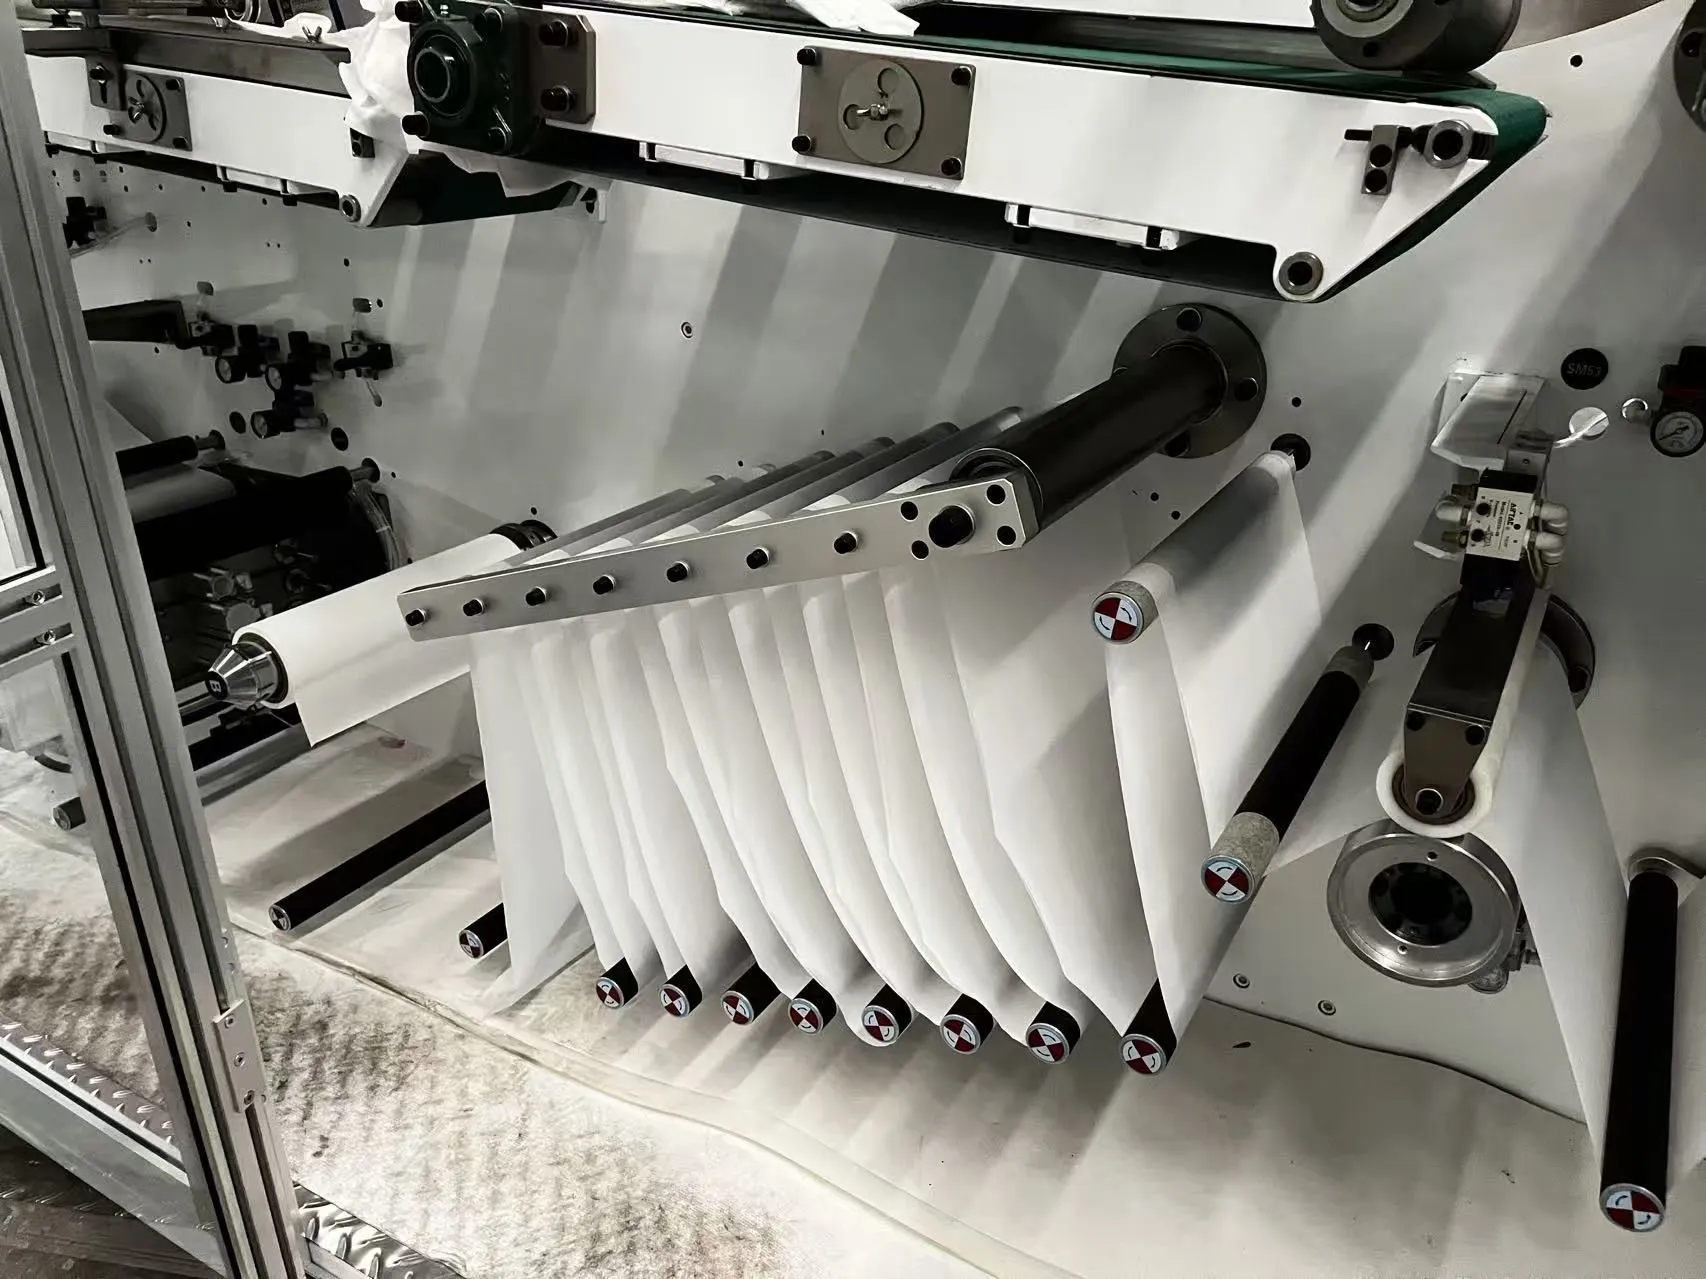
The gap between 0.3% and 1.2% sounds small in percentage terms. On a 300-million-piece annual line at a private-label ASP of USD 0.045, it is roughly USD 120,000 of finished-goods value destined for the scrap bin or a discount channel every year. Add the labor cost of the rework line, and the total invisible OPEX line item is closer to USD 180,000 — none of which appeared on the CAPEX projection.
6 · The full picture — what to add to your CAPEX template
Add the four items above to a standard CAPEX projection template as OPEX side notes, sized to your annual volume:
| Hidden cost item | Legacy mechanical line | Servo line + recipe HMI | Approx. annual gap (300M pcs) |
|---|---|---|---|
| SAP loss % | 4–7% | 1.5% | USD 200K – 400K |
| Paid idle labor hours / year | 60,000+ | Under 20,000 | USD 240K |
| Raw material safety stock | 4–6 weeks | 2 weeks | USD 400K – 700K working capital freed |
| Outgoing defect / rework rate | 0.8–1.5% | 0.3–0.5% | USD 120K – 180K |
Total picture across four items — for a mid-size private-label sanitary napkin operation running 300 million pieces per year, the gap between a legacy and a well-matched servo line is on the order of USD 1 million per year of operating cost and working capital combined. That number is the private-label margin. It is not a cost to optimize later; it is the number the CAPEX decision is quietly deciding.
What to add to your CAPEX template before the next PO: four extra rows in the OPEX projection, sized to your annual volume and your labor rate. If the supplier cannot fill those four rows with numbers from a reference site — as opposed to numbers from their sales brochure — the quote is incomplete. It should not be signed.
7 · Why Welldone Machinery
Every one of the four hidden cost items above is engineered, not managed around. Buyers work with Welldone Machinery because we quote the total operating cost — not the invoice price. Our S3 and S5 servo lines carry recipe HMI, pre-loaded splice magazines, and closed-loop vision as standard configuration, and we publish the reference-site OPEX numbers on every one of the four items before the PO is signed.
Why Welldone Machinery quotes total operating cost
01 · SAP DISCIPLINE
1.5% SAP loss contractual target
Servo dosing + recipe HMI holds SAP loss at 1.5% or under across the SKU mix in the technical agreement — measured at SAT, published in the reference-site pack.
02 · LABOR EFFICIENCY
Sub-15-minute changeover as standard
Recipe-based HMI + pre-loaded splice magazines cut paid idle labor from 60,000 hours to under 20,000 hours per year on a three-shift operation.
03 · REFERENCE OPEX
Total operating cost, not sales price
Every quote includes reference-site OPEX numbers on SAP loss, changeover labor, working capital, and rework rate — the four items your P&L will report on.
9 · Conclusion
Every private-label sanitary napkin CAPEX projection I have reviewed in the last three years has been optimized around the equipment invoice price. Every year-one P&L I have reviewed in the same period has been decided by four operating cost items the CAPEX projection never mentioned.
The four items are not soft variables. They are not "we will manage that later" line items. They are engineered into — or engineered out of — the specification the day the PO is signed. Everything after that is either enforcement or damage control.
An open question to take back to your finance team: when your next sanitary napkin line quotation lands on the CFO's desk, ask the supplier to attach a one-page OPEX projection covering SAP loss, changeover labor, safety stock, and outgoing defect rate — with reference-site numbers, not brochure numbers. Suppliers who can produce that page are a short list. Suppliers who cannot are the ones your year-one P&L will remember.
10 · Frequently asked questions
What is a realistic SAP loss percentage on a modern full-servo sanitary napkin line?
1.5% total SAP loss across startup, steady-state production, and SKU changeovers is realistic and can be written into the technical agreement as a contractual target. Anything above 3% on a supposedly full-servo line points to a missing recipe HMI or a metering system without closed-loop dosing feedback.
How do I estimate my line's true annual paid-idle labor cost?
Formula: (changeover minutes) × (changeovers per shift) × (shifts per day) × (working days per year) × (operators standing idle) × (fully loaded labor rate). For a typical mid-size operation on a legacy line, the number lands between USD 300,000 and USD 500,000 per year. Compare to the same calculation with a 12-minute changeover assumption to see the gap.
Why does safety stock drop so much on a servo line?
Because the reasons a legacy line needs 4-6 weeks of buffer — unpredictable changeover times, manual splice failure risk, operator error on parameter entry — are engineered out of a servo line with recipe HMI and pre-loaded splice magazines. The buffer is not compressed by better inventory management; it is compressed because the variability that required the buffer no longer exists.
What defect rate can I contractually require in a private-label supply agreement?
0.5% outgoing defect rate is defensible on a well-matched servo line and can be written into the SAT acceptance criteria. Anything tighter than 0.3% starts to hit the physical limit of what in-line vision can catch reliably, and pushes cost into a level of inspection redundancy most buyers do not want to pay for.
Can Welldone Machinery provide the reference-site OPEX numbers before I sign the PO?
Yes. Every sanitary napkin line quotation from Welldone Machinery includes a reference-site OPEX pack — SAP loss percentage, changeover labor hours, safety stock weeks, and outgoing defect rate — from a comparable line running today. If a supplier will not attach that data to the quote, the commercial discussion is premature. Send us your SKU envelope and annual volume target and we will attach it to the quote.
Building a sanitary napkin line business case or reviewing an existing quote?
If you are budgeting a new private-label program, or trying to explain a year-one P&L that came in below plan on equipment that looked correctly specified, we can walk you through the four-item OPEX projection — based on real production data from lines running today.